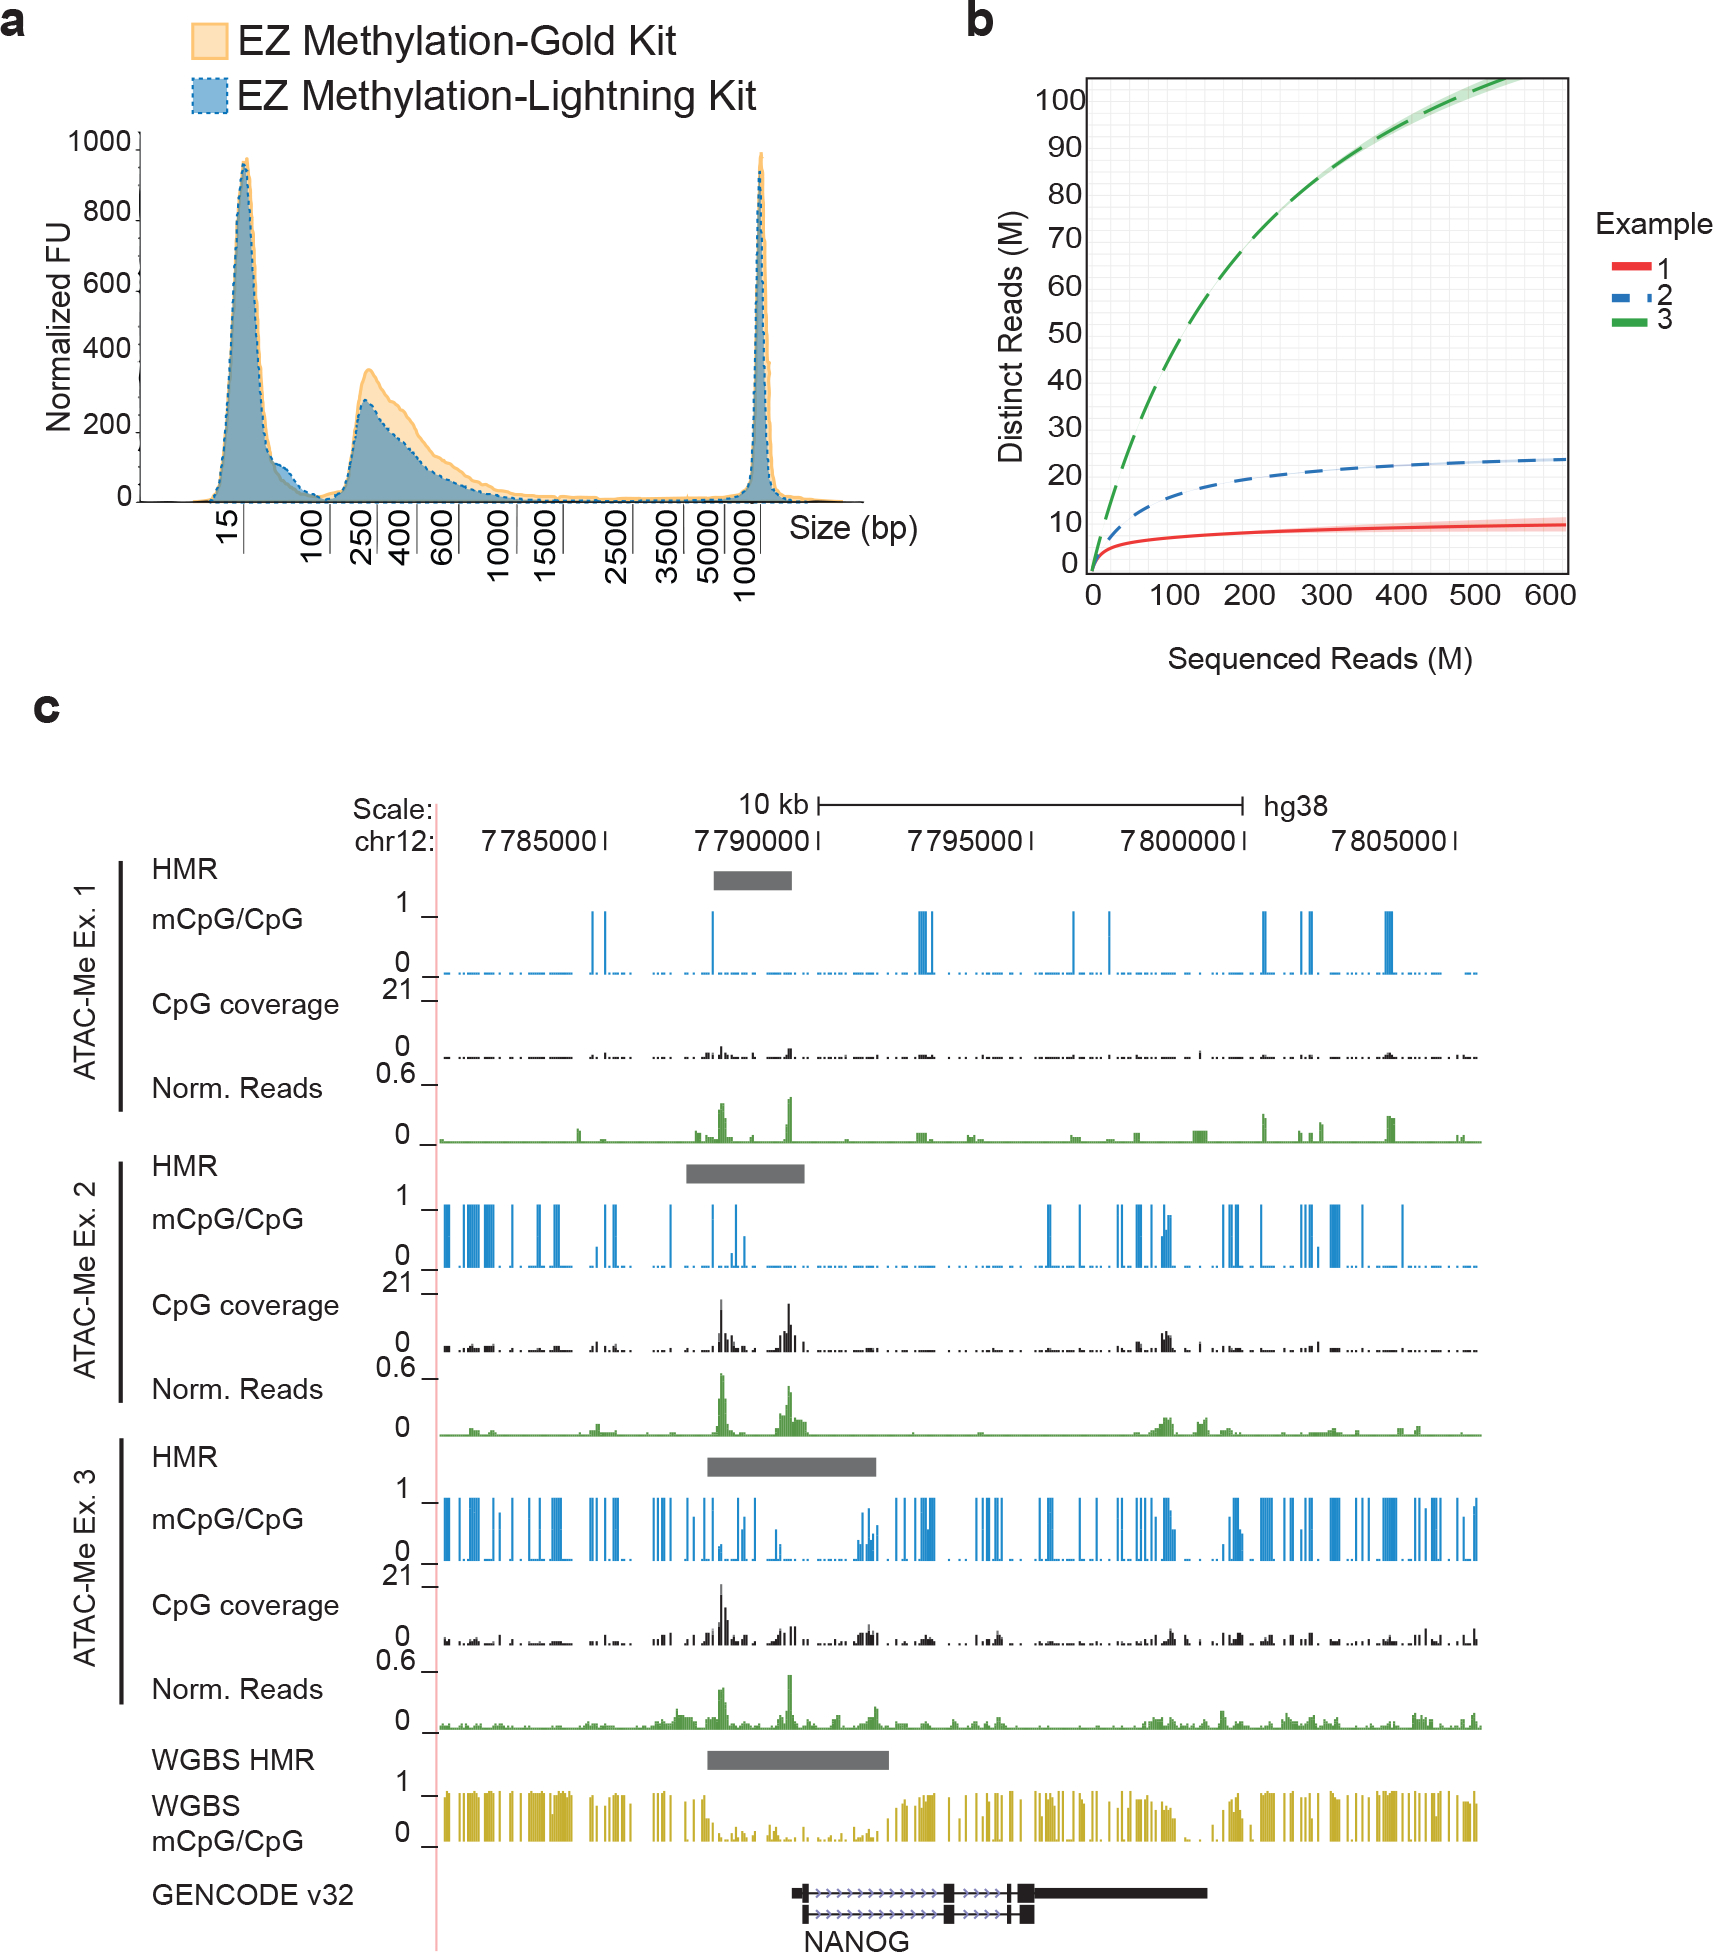
Figure 3. Assessing library complexity versus data quality.

(a) Fragment distribution of libraries converted using the EZ Methylation-Gold Kit (gold solid line) and EZ Methylation-Lightning Kit (blue dotted line). Fragment distributions are representative of electropherograms visualized on Agilent Tape Station results files. y-axis displays normalized fluorescence units (FU). (b) Sequence complexity was calculated using Pre-seq57 for three example ATAC-Me libraries of H9 ESCs representing a range of sequenced DNA fragment complexities. (c) Genome Browser tracks surrounding the Nanog locus for three ATAC-Me examples of H9 ESCs are shown alongside tracks of whole genome methylation data from Xie et al. 201316 (gold track). Single CpG methylation levels are shown as vertical blue bars with height corresponding to fraction methylation (calculated as mCpG reads/total CpG reads). The read coverage of each CpG is represented as the height of the black bars. Reads normalized to library depth are shown in green to represent accessibility signal calculated for each sample. Hypomethylated regions (HMRs) were determined using the MethPipe software package and correspond to peaks called by Genrich software (available at https://github.com/jsh58/Genrich)48.
