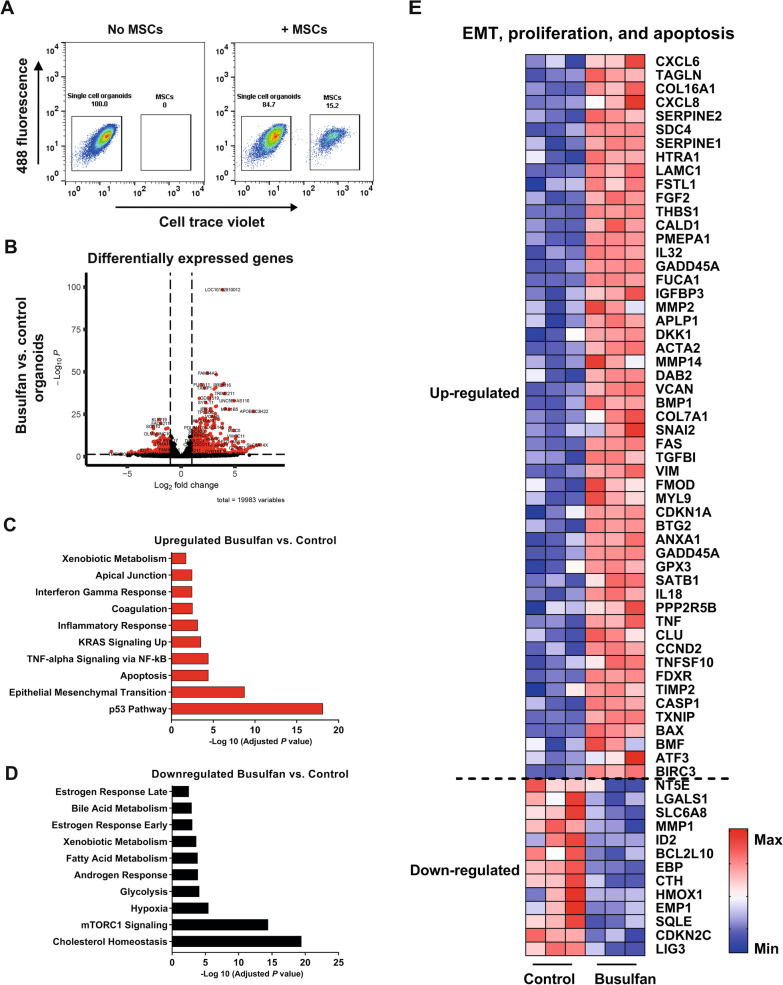
Fig. 4.
Transcriptomic analysis of busulfan-treated small intestine organoids. A Busulfan-treated organoids or control organoids were co-cultured with CellTraceTM violet dye-labelled MSCs for 48 h and single cell small intestine organoid were isolated from these co-cultures by FACS sorting. B DE analysis between control and busulfan-treated small intestine organoids (red dots indicate significant genes; p value < 0.05) and the accompanying upregulated (C) and downregulated (D) pathways. E Heat map of the differentially expressed genes involved in the EMT, proliferation, and apoptosis pathway in control organoids and busulfan-treated organoids is shown (N = 3)

