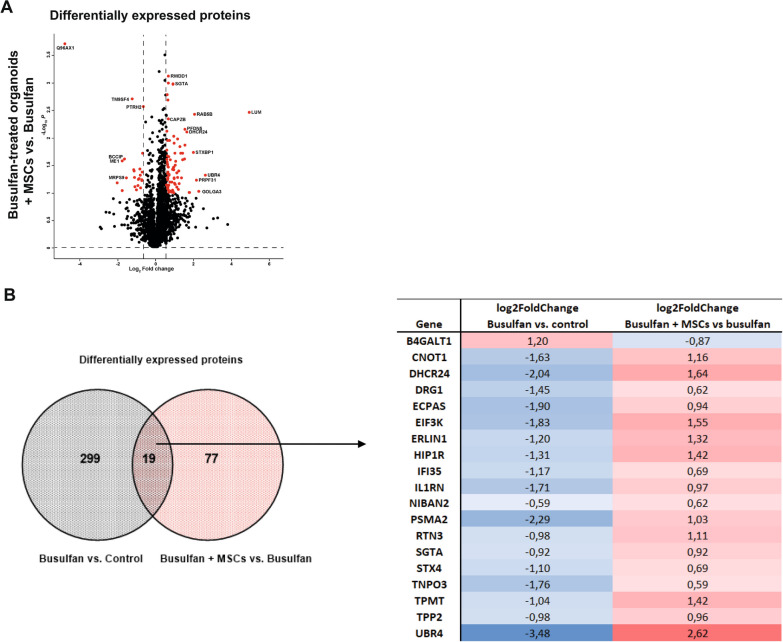
Fig. 7.
Proteomic analysis of busulfan-treated small intestine organoids co-cultured with and without MSCs. A DE analysis between busulfan-treated organoids co-cultured with 10,000 MSCs and without MSCs (red dots indicate significant proteins; adjusted p value ≤ 0.1 and ≥ 1.5-fold change differences). B Venn diagram of the DE proteins in busulfan-treated organoids as compared to control (grey circle) and of DE proteins in busulfan-treated organoids co-cultured with and without MSCs (red circle) and the accompanying heat map analysis is shown

