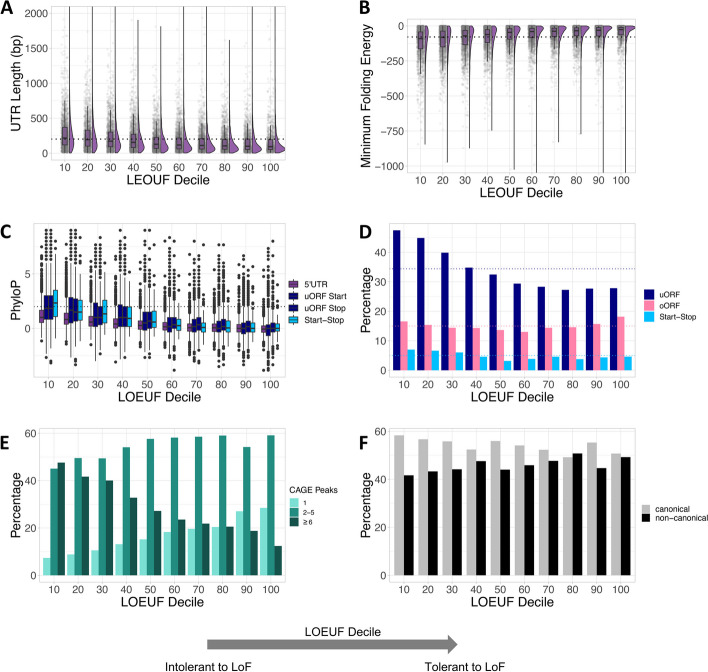
Fig. 2.
Genes intolerant to LoF have longer and more complex 5’UTRs. A 5’UTRs increase in length with decreasing tolerance to LoF (Wilcoxon P<1x10-15). The average 5’UTR length across all genes (202 bp) is shown by a dotted line. The y-axis was truncated at 1,500 bp (39 genes had 5’UTRs >1,500 bp). B The 5’UTRs of genes most intolerant to LoF have lower minimum free energy (MFE) scores, representing a higher propensity to fold and create structured mRNAs (Wilcoxon P<1x10-15). The average MFE across all 5’UTRs is shown as a dotted line (-78.8). The y-axis was truncated at -1,000 (6 genes had MFE <-1000). C The 5’UTRs of genes most intolerant to LoF are more conserved. Average PhyloP scores are plotted for 5’UTRs, uORF start codons, uORF stop codons and start-stops. The dotted line denotes PhyloP=2. D Genes most intolerant to LoF are more likely to have uORFs (Chi-square P<1x10-15) and start-stops (Chi-square P=8.5x10-05) than genes most tolerant to LoF. The average numbers of each uAUG type across all 5’UTRs are shown by dotted lines. uORF: upstream open reading frame; oORF; overlapping open reading frame. E Genes most intolerant to LoF were significantly more likely to have multiple associated CAGE peaks when compared to genes most tolerant to LoF (CAGE peak >1, 91.9% vs 72.4%, Chi-square P<1x10-15; CAGE peak ≥6, 44.6% vs 16.3%, Chi-square P<1x10-15). F Whilst Ribo-seq uORFs in genes intolerant to LoF appear to more frequently have canonical start-codons, this difference is not statistically significant (Chi-square P=0.18). All statistical tests compare the lowest and highest two LOEUF deciles

