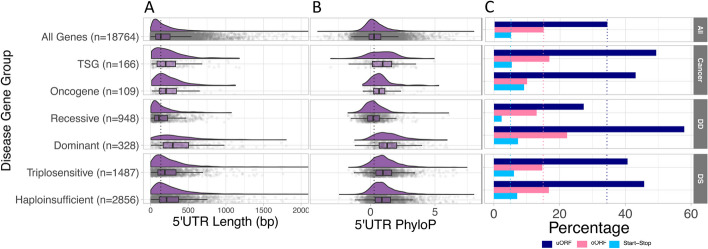
Fig. 3.
Comparison of 5’UTRs across disease genes sets. A The 5’UTRs of disease genes are significantly longer (Wilcoxon: DD dominant: P<1x10-15; Onc: P=1.5x10-05; TSG:P=2.9x10-04; HS: P<1x10-15; TS: P<1x10-15) with the exception of DD recessive genes which are significantly shorter (Wilcoxon P=2.7x10-08), when compared to the average across all genes. The median 5’UTR length for all genes (136 bp) is shown by the dotted black line. The x-axis was truncated at 2,000 bp (22 genes had 5’UTRs >2,000 bp). B Disease gene 5’UTRs are significantly more conserved (T-test: DD dominant: P<1x10-15; Onc: P=9x10-06; TSG: P=4.3x10-08; HS: P<1x10-15; TS: P<1x10-15) except DD recessive genes which are significantly less conserved (T-test: P=4.9x10-08), compared to all genes. The dotted black line is the median PhyloP score for all genes (0.28). C Disease genes significantly more often contain uORFs (Chi-square: DD dominant: 57.9%, P<1x10-15; TSG=49.4%, P=6.5x10-05; HS=45.7%, P<1x10-15; TS=40.7%, P=1.4x10-07), when compared to all 5’UTRs. Start-stops are only significantly enriched in HS genes (P=3.1x10-08). The dotted lines mark the percentage of all genes with each uAUG type

