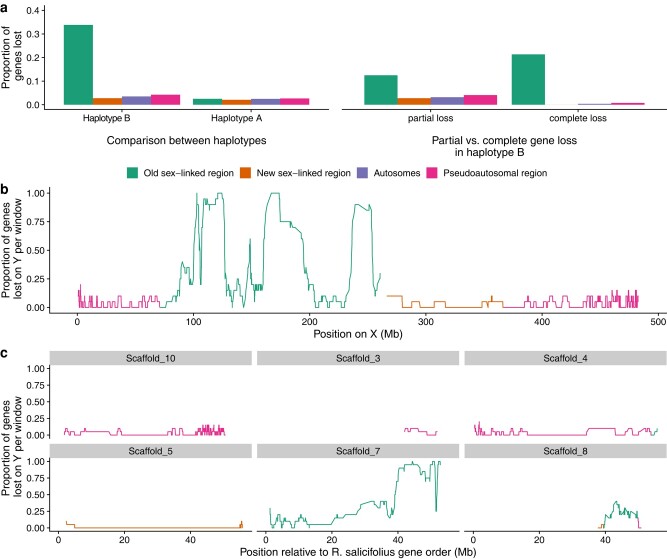
Fig. 5.
a) Proportion of genes lost within the sex-linked regions, pseudoautosomal regions, and autosomes in R. hastatulus. Left panel: comparison of genes that are absent from the Y-bearing haplotype B, while present on the X-bearing haplotype A assembly, and vice versa. Right panel: proportion of partially lost versus completely lost genes across regions. b) Proportion of genes lost on Y calculated in 20 gene windows along the X chromosome. c) Proportion of genes lost on Y calculated in 20 gene windows with respect to the positions of their syntenic genes in R. salicifolius scaffolds.

