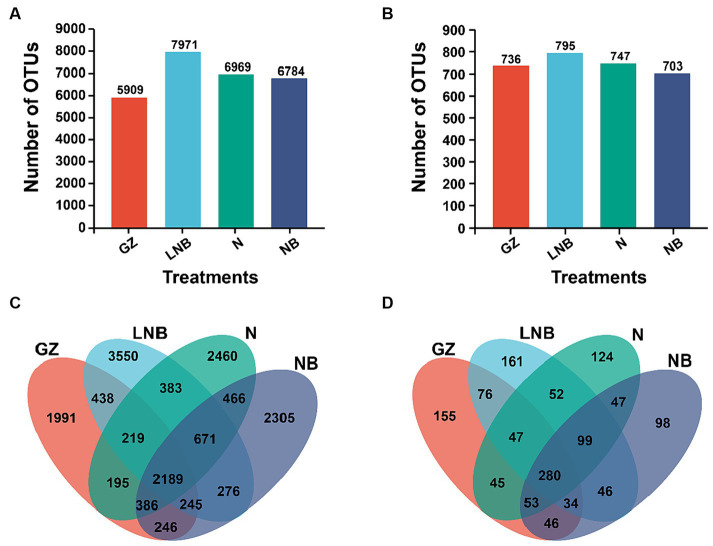
Figure 5.
Operational taxonomic units (OTUs) analysis of bacterial and fungal communities under different treatments. Bar plots displaying the total numbers of bacterial (A) and fungal (B) OTUs under different treatments (as described in Figure 1). Venn diagram showing the unique and shared bacterial (C) and fungal (D) OTUs among the treatments (as described in Figure 1).

