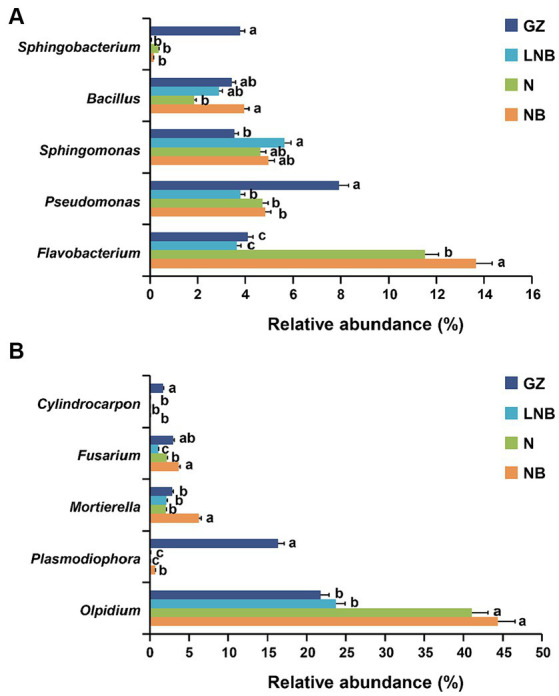
Figure 7.

Relative abundance (RA) bar plots of most abundant genera under different treatments. RA bar plots of bacterial (A) and fungal (B) genera level. Significant difference in the RA of specific genera among the treatments (as described in Figure 1) is shown by different small letters on the error bar according to the least significant difference (LSD) test at p < 0.05.
