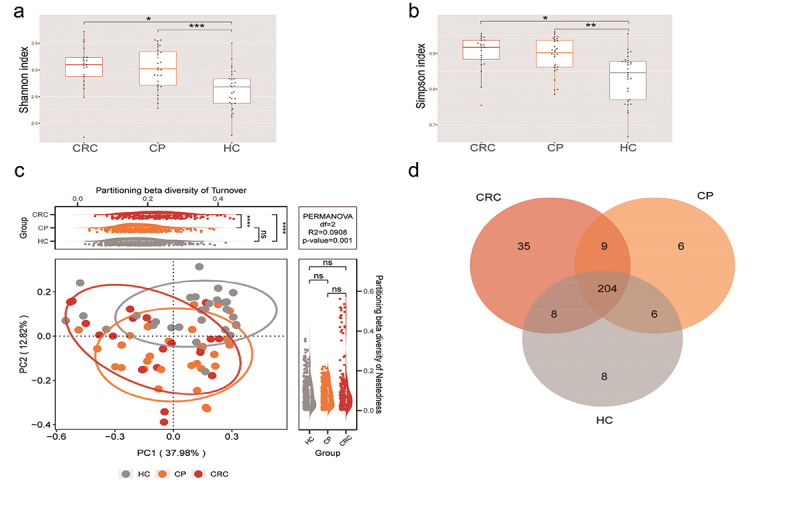
Figure 2.

Microbial diversity analysis among three groups. (a,b) α-diversity indexes in the CRC, CP, and HC groups (observed, diversity Shannon and Simpson indexes depict diversity). (c) PCoA for β-diversity analysis. Red, orange, and grey represent different samples from the three groups. The structure and composition of the tongue coating microbiota were significantly different among the three groups. (d) Numbers of enriched OTUs between each compartment. Statistical significance by *p < 0.05, **p < 0.01, ***p < 0.001, ****p < 0.0001; ns, non-significant. HC: healthy controls, CP: patients with colorectal polyps (CP), CRC: patients with colorectal cancer.
