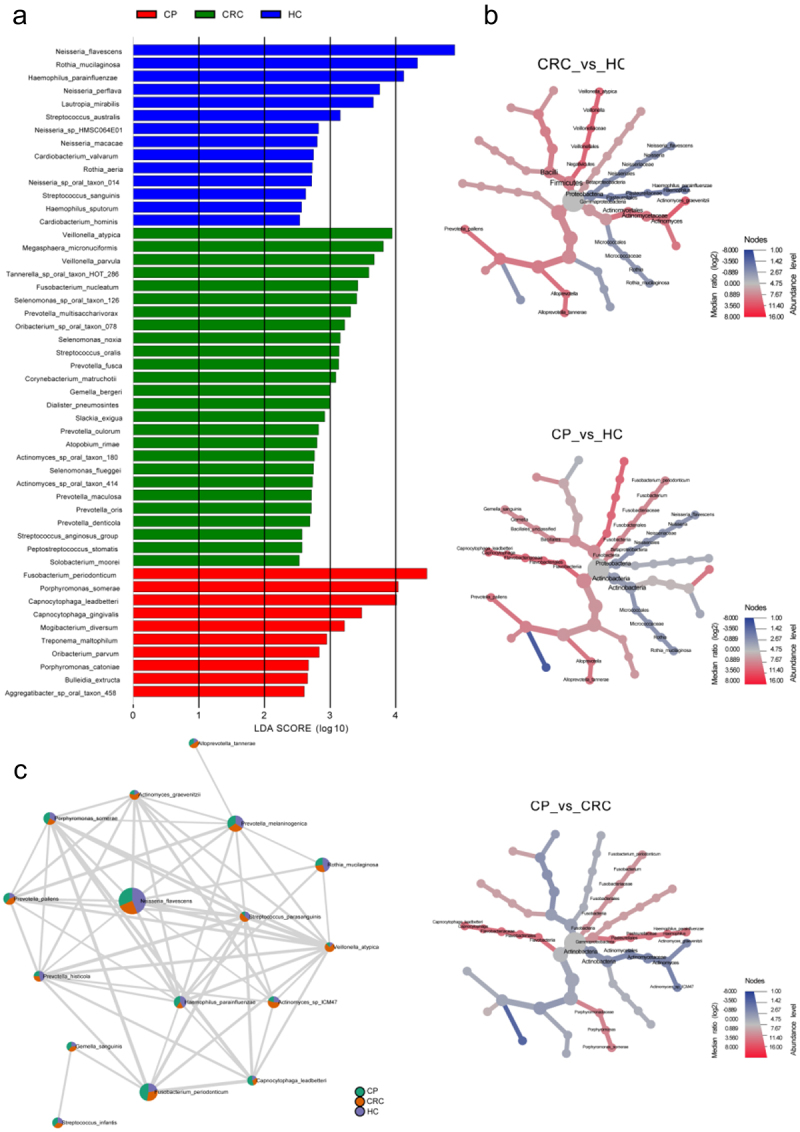
Figure 4.

Differences in tongue coating microbiota from phylum to species in the CRC, CP, and HC groups. (a) Microbiome biomarkers were identified using a logarithmic linear discriminant analysis (LDA) effect size (LefSe) threshold > 2.0. (b) HeatTree for clustering analysis. Red indicates a significant increase of abundance, while blue depicts the opposite. (c) Co-occurrence network analysis of tongue coating microbiota using Pearson’s correlation coefficient. A node represents a species. The node size indicates the level of abundance. Color scale indicates the proportion of bacterium in the three groups separately. Red depicts CRC patients, green depicts CP while purple depicts HC. Connecting lines indicate the strength of the relationship. HC: healthy controls, CP: patients with colorectal polyps (CP), CRC: patients with colorectal cancer.
