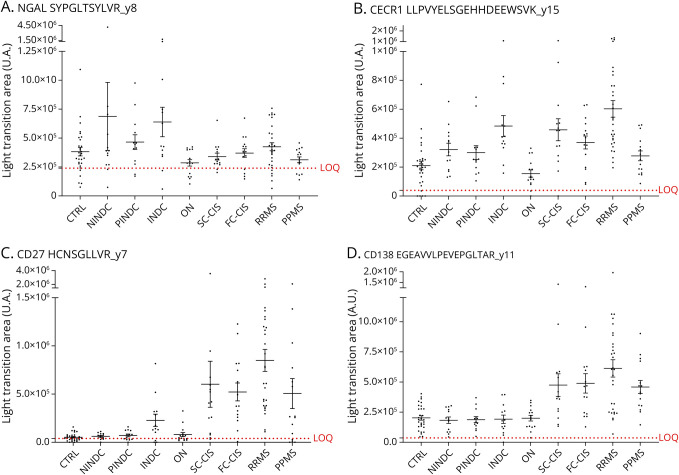
Figure 3. PRM Analysis of Peptides From 4 Candidate Protein Biomarkers in the Verification Cohort.
Intensity (light transition area in arbitrary units [A.U.]) of peptides showing difference in abundance in CSF samples of the verification cohort (Table 2) is shown for NGAL (A), CECR1 (B), CD27 (C), and CD138 (D). The LOQ (limit of quantification) is indicated (red dotted line) for each peptide. Statistical analyses of group comparisons are provided in Table 3. CTRL: symptomatic controls (n = 30); CIS: clinically isolated syndrome; SC-CIS: slow converter CIS (n = 15); FC-CIS: fast converter CIS (n = 15); RRMS: relapsing-remitting multiple sclerosis (n = 30); PPMS: primary progressive multiple sclerosis (n = 14); INDC: inflammatory neurologic disease control (n = 13); ON: isolated optic neuritis (n = 15); NINDC: noninflammatory neurologic disease control (n = 13), PINDC: peripheral inflammatory neurologic disease control (n = 13).

