
Figure 2.
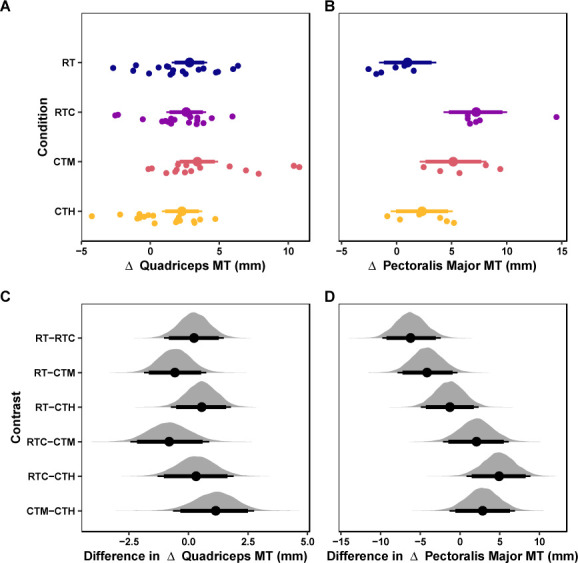
Hypertrophy Outcomes.
Marginal posterior distributions for changes in quadriceps (A) and pectoralis major muscle thickness (B) and differences among conditions for quadriceps (C) and pectoralis major muscle thickness (D). Vertical dashed lines represent the region of practical equivalence (i.e., ROPE) defined by the typical error of measurement. Colored dots and intervals represent the mean and quartile intervals (90 and 95%) from the posterior distribution. Finally, individual data are visualized below with solid circles. The marginal effects are adjusted for the pretest scores of the dependent variable, and the measurement site.