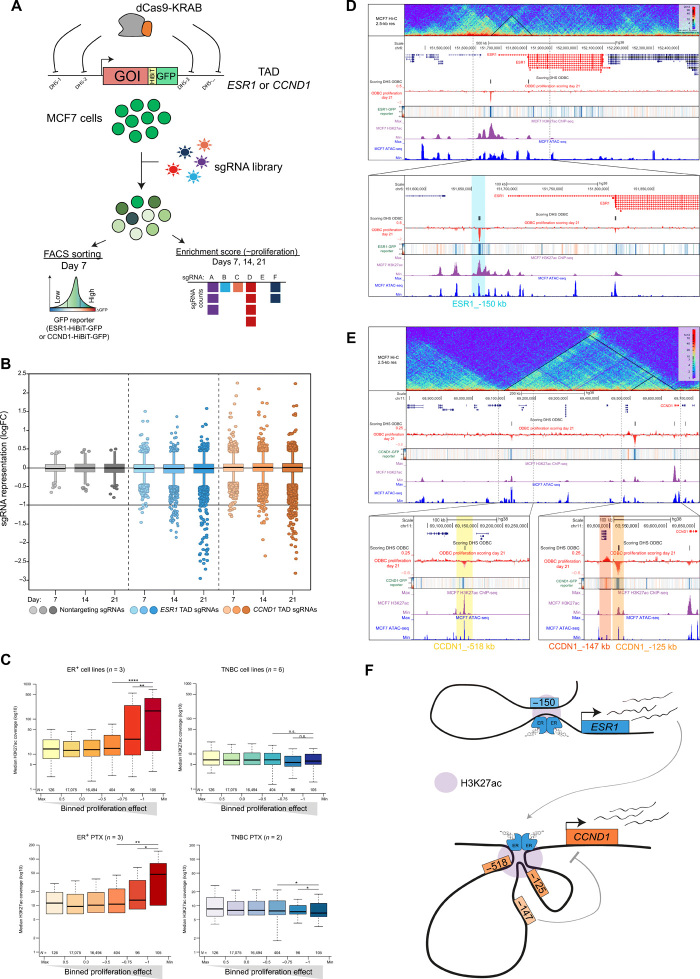
Fig. 1. High-resolution CRISPRi screen identifies critical TREs controlling ESR1 and CCND1.
(A) Schematic representation of the ODBC screen. GOI, gene of interest. (B) Box plot showing the representation of the ODBC library at days 7, 14, and 21. Nontargeting sgRNAs are negative controls. Data represent median logFC of three experiments. (C) Median H3K27Ac ChIP-seq signal (log10) at sgRNA target regions in ER+ and TNBC models binned by the ODBC logFC at T = 21 days (proliferation effect). TNBC, triple-negative breast cancer; PTX, primary tumor xenografts. *P < 0.05, **P < 0.01, ****P < 0.0001, and not significant (n.s.), P > 0.05. (D) Snapshot of the ESR1 locus showing Hi-C data (top track), the ODBC screening results (cell proliferation and GFP reporter), H3K27Ac ChIP-seq, and ATAC-seq in MCF7 cells. (E) Snapshot of the CCND1 locus showing Hi-C data (top track), the ODBC screening results (cell proliferation and GFP reporter), H3K27Ac ChIP-seq, and ATAC-seq in MCF7 cells. (F) Model depicting the findings of the ODBC screen.

