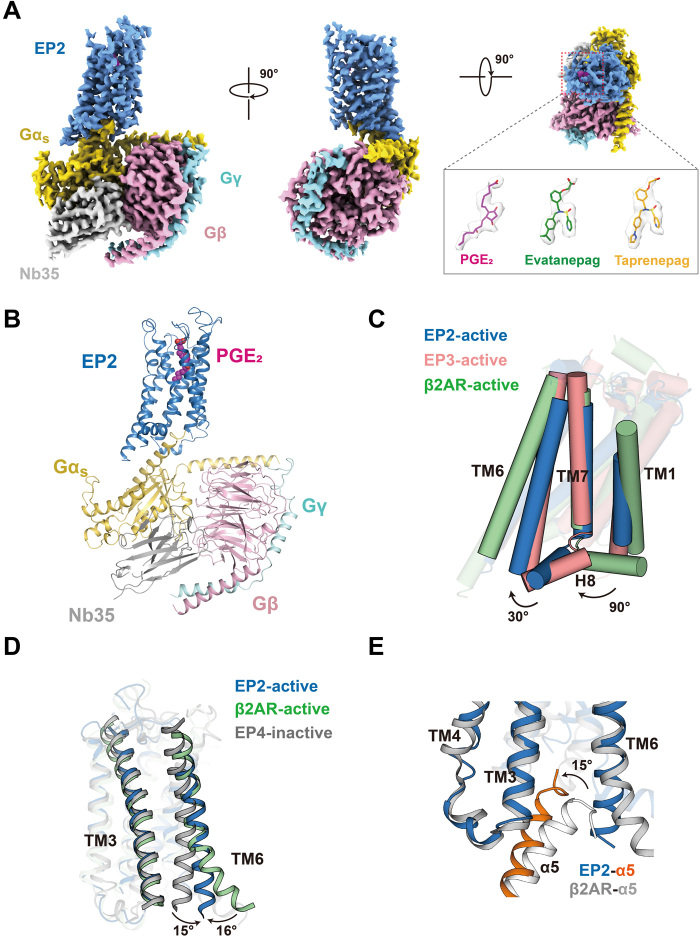
Fig. 1. Cryo-EM structures of EP2-Gs complexes.
(A) Cryo-EM density of EP2-Gs in complex with PGE2, EVA, or TAP. EP2, blue; Gαs, yellow; Gβ, pink; Gγ, cyan; Nb35, gray; PGE2, red; EVA, green; and TAP, orange. (B) Ribbon representation of the PGE2-EP2-Gs complex. EP2, blue; Gαs, yellow; Gβ, pink; Gγ, cyan; Nb35, gray; and PGE2, red. (C) Comparison of the EP2-Gs complex with the β2AR-Gs complex [Protein Data Bank (PDB) ID: 3SN6] and the active EP3 structure (PDB ID: 6AK3). The orientations of H8 of both EP2 and EP3 are significantly different from the Gs-coupled receptor β2AR. (D) Comparison of the EP2-Gs complex with the β2AR-Gs complex (PDB ID: 3SN6) and the inactive EP4 structure (PDB ID: 5YHL). The separation between TM3 and TM6 of the EP2-Gs complex was larger than the inactive EP4 structure but significantly smaller than the β2AR-Gs complex. (E) Comparison of the EP2-Gs complex structure with the β2AR-Gs complex structure (PDB ID: 3SN6). The α5 helix of the Gs in the EP2-Gs complex tilted 15° compared to that in the β2AR-Gs complex.

