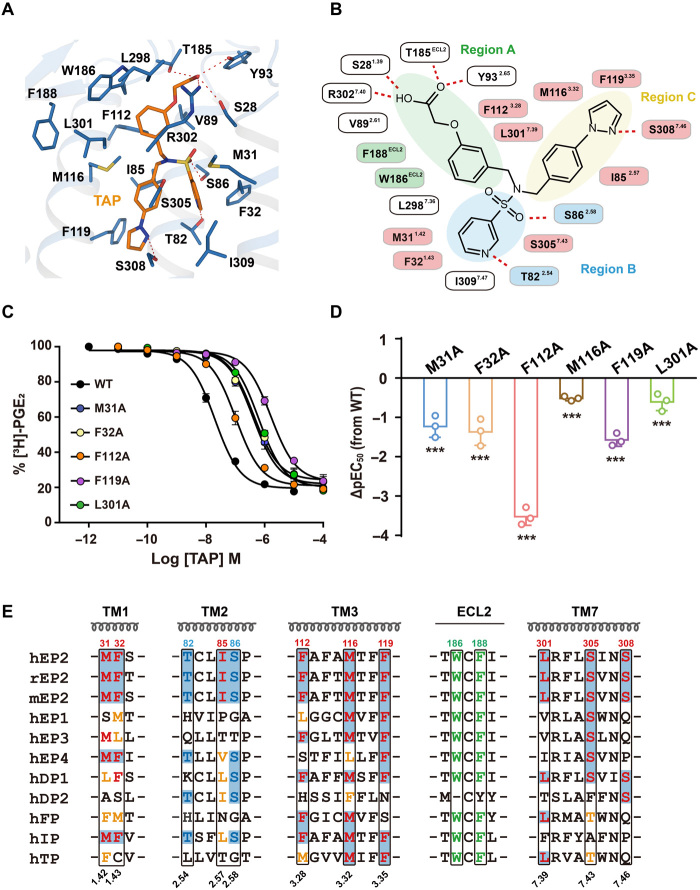
Fig. 3. Specific engagement of TAP with EP2.
(A) Detail interactions of TAP (marine) with EP2 (orange) were shown. H-bonds were depicted as red dashed lines. (B) 2D representation of contacts between EP2 with the ligand TAP. The polar bonds were presented by red dotted lines. Residues F188ECL2 and W186ECL2 that were implicated in hydrophobic interactions with the region A subpocket were presented in green. T822.54 and S862.58 formed stronger H-bond engagements with the region B subpocket and were presented in blue. The hydrophobic contacts of EP2 with TAP were colored pink. (C and D) Effects of mutations of TAP contacting residues in ligand binding and Gs signaling. The competitive binding curve of TAP toward EP2 was created using 3H-PGE2 as the isotope probe (C). Bars represent the differences in calculated potency of TAP (△pEC50) for each mutation according to wild-type (WT) EP2. ***P < 0.0001 [one-way analysis of variance (ANOVA) compared with the response of WT] (D). See fig. S5 (E and F) for detailed statistical evaluation and fig. S4D for receptor expression levels. (E) Sequence alignment of prostonoid receptors. Note that the combination of F1123.28 and L3017.39 was only found in EP2, DP1, and FP; I852.57, F1193.35, S3057.43, and S3087.46exhibited great diversity among prostonoid receptor families.

