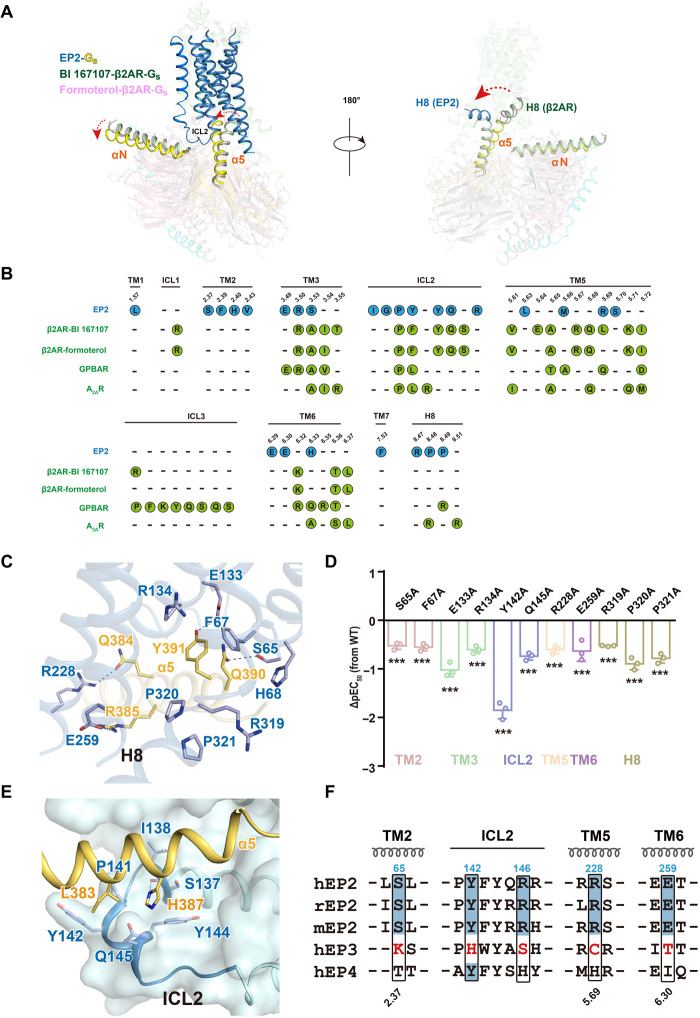
Fig. 5. EP2-Gs coupling and G protein selectivity.
(A) Superposition of the structures of EP2-Gs and β2AR-Gs (PDB ID: 3SN6 and 7BZ2) complex according to the transmembrane helices bundle. EP2 is in sky blue, BI 167107-β2AR is in green, and formoterol-β2AR is in light pink. Rotation of the α helices and the interaction of the Gαs with H8 were highlighted, Gαs in the EP2-Gs complex is in yellow orange, Gαs in BI 167107-β2AR-Gs is in green, and Gαs in formoterol-β2AR-Gs is in light pink. (B) Comparison of the Gs coupling interface in EP2 and known receptor-Gs complexes including β2AR-Gs (PDB ID: 3SN6 and 7BZ2), GPBAR-Gs (PDB ID: 7CFN), and A2AR–mini-Gs (PDB ID: 6GDG). Residues involved in contacting with Gs of EP2 were illustrated as blue dots, and those of β2AR, GPBAR, and A2AR were illustrated as green dots. (C) The detailed interactions of α5 helix of Gs with residues of TM2 and H8 of EP2 in the PGE2-bound EP2-Gs complex structure. Polar interactions are depicted as blue dashed lines. (D) Effects of mutations in TM2 or H8 of EP2 on PGE2-induced cAMP accumulation. Bars represent the differences of calculated potency (pEC50) between WT EP2 and its mutant. Values are means ± SD from three independent experiments performed in triplicate. ***P < 0.001; comparison between WT EP2 and its mutant. All data were analyzed by two-sided one-way ANOVA with Tukey’s test. (E) The detailed interactions of ICL2 of EP2 with α5 helix of Gs in the PGE2-bound EP2-Gs complex structure. H-bond is depicted as a dashed line. (F) Sequence alignment of residues involving Gs coupling in human, mouse, and rat EP2, which are compared with residues at corresponding positions in human EP3 and EP4.

