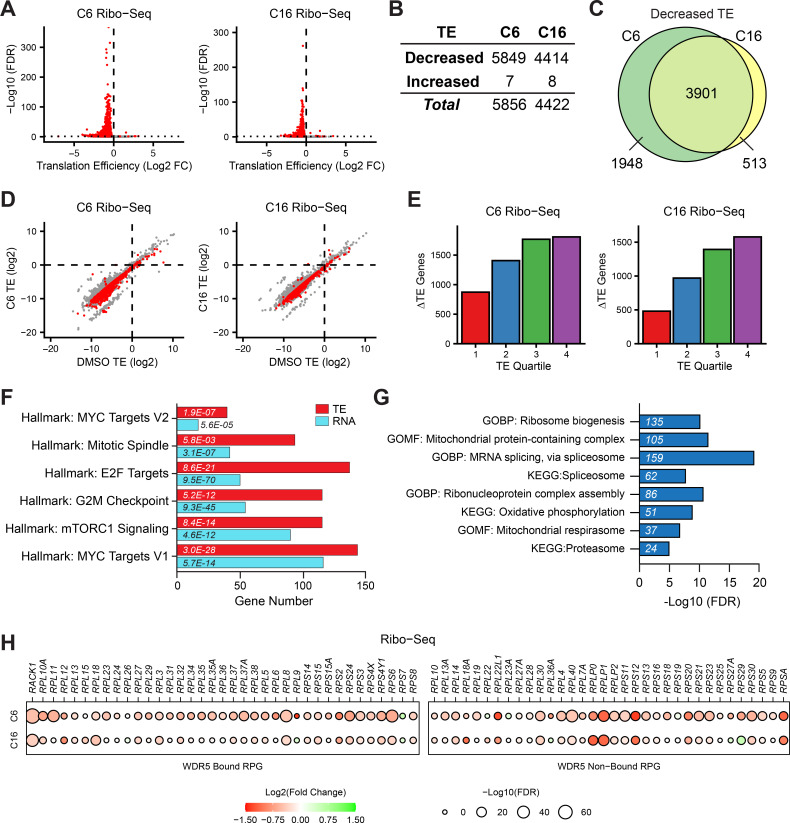
Figure 2. Impact of WIN site inhibitors (WINi) on the translatome of MLLr cancer cells.
(A) Volcano plots depicting alterations in translation efficiency (TE) induced by 48 hr treatment of MV4;11 cells with either 2 µM C6 (left) or 100 nM C16 (right) compared to DMSO (n = 2; red indicates false discovery rate [FDR] < 0.05 and Log2 FC > 0.25), as determined by Ribo-seq. (B) Number of mRNAs with significantly (FDR < 0.05 and Log2 FC > 0.25) altered TE levels following treatment of MV4;11 cells with C6 (2 µM) or C16 (100 nM) for 48 hr. See Figure 2—source data 1 for complete output of Ribo-seq analysis. (C) Overlap of mRNAs with significantly decreased TE in response to C6 or C16 treatment. (D) TE of mRNAs in DMSO-treated MV4;11 cells plotted against translation efficiencies of mRNAs in cells treated with either C6 (left) or C16 (right). Red indicates mRNAs with significantly altered translation efficiencies following inhibitor treatment (FDR < 0.05 and Log2 FC > 0.25). (E) Numbers of differentially translated mRNAs (∆TE) in each quartile of genes (stratified by TE in DMSO) in cells treated with C6 (left) or C16 (right). (F) Enrichment analysis of common mRNAs suppressed by C6/C16 at the mRNA (blue) and translational (red; TE) level in MV4;11 cells. Hallmark.MSigDB pathways are shown. The x-axis indicates the number of suppressed genes in each category; the italic numbers are the corresponding FDR. See Figure 2—source data 2 for the full Hallmark.MSigDB analysis, as well as for Reactome and KEGG pathways. (G) Enrichment analysis of mRNAs suppressed translationally by C6/C16 but with no significant changes in mRNA levels. Gene Ontology (GO) Biological Process (BP) and Molecular Function (MF) categories are shown, as well as KEGG pathways. The x-axis displays -Log10 FDR; the number of mRNAs is shown in italics in each bar. See Figure 2—source data 3 for extended enrichment analyses, broken down by TE and mRNA direction changes. (H) TE changes in WDR5-bound (left) and non-bound (right) RPGs elicited by C6 (top) or C16 (bottom).


