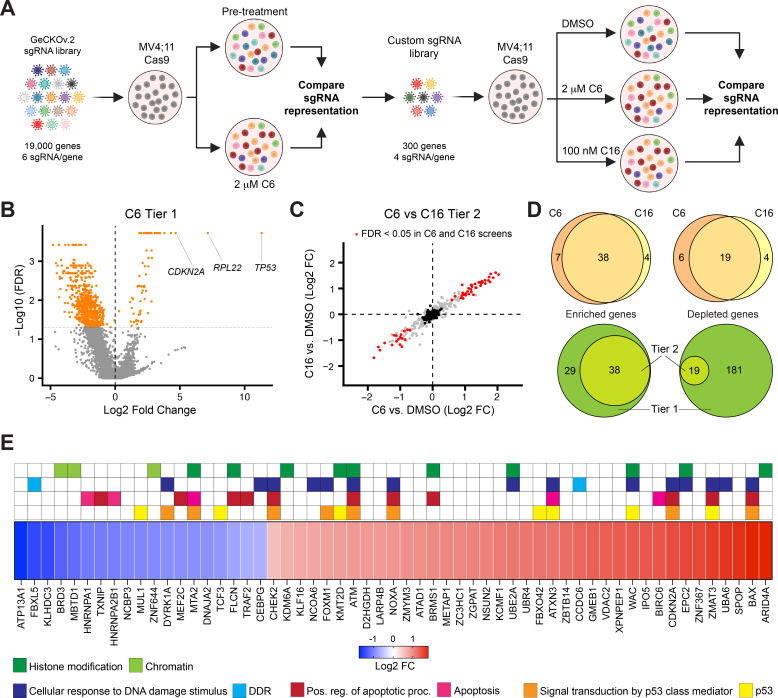
Figure 4. A two-tier loss-of-function screen for modulators of the response to WIN site inhibitors (WINi).
(A) Two-tier screen design. In the first tier, Cas9-expressing MV4;11 cells were transduced with a genome-wide sgRNA library and treated with 2 µM C6 until a resistant cell population emerged. sgRNA representation in the pretreatment population was compared to the post-treatment population (n = 2). In the second tier, cells were transduced with a custom library of distinct sgRNAs targeting non-pan-essential ‘hits’ from the first tier, cultured in the presence of DMSO, C6, or C16, and sgRNA representation in C6/C16-treated cultures compared to that from DMSO-treated cultures (n = 2). (B) Volcano plot, showing gene-level changes in sgRNA representation from the first tier (orange indicates false discovery rate [FDR] < 0.05). Datapoints corresponding to TP53, RPL22, and CDKN2A are indicated. See Figure 4—source data 1 for full output of the tier 1 screen. (C) Comparison of gene-level changes in sgRNA representation in C6- and C16-treated populations in the second tier screen, each compared to DMSO-treated populations (red indicates FDR < 0.05; black indicates non-targeting control sgRNAs). See Figure 4—source data 2 for full output of the tier 2 screen. (D) Top: overlap of genes from the tier 2 screen with enriched (left) or depleted (right) sgRNAs in C6- and C16-treated MV4;11 populations, compared to the DMSO control. Bottom: overlap of genes with enriched (left) or depleted (right) sgRNAs in the first versus second tiers of the screen. ‘Tier 1’ contains only those genes targeted in the tier 2 screen. ‘Tier 2’ contains the intersection of genes with altered sgRNAs in both the C6 and C16 treatments. (E) Ranked heatmap, representing the mean gene-level Log2 fold change (FC) of sgRNAs from the C6 and C16 treatments in the tier 2 screen, as well as gene enrichment analysis outputs. Note that ‘Signal transduction by p53 class mediator’ is a GO:BP term (orange); ‘p53’ assignments (yellow) were added by manual curation.
© 2024, BioRender Inc
Figure 4A was created using BioRender, and is published under a CC BY-NC-ND license. Further reproductions must adhere to the terms of this license.


