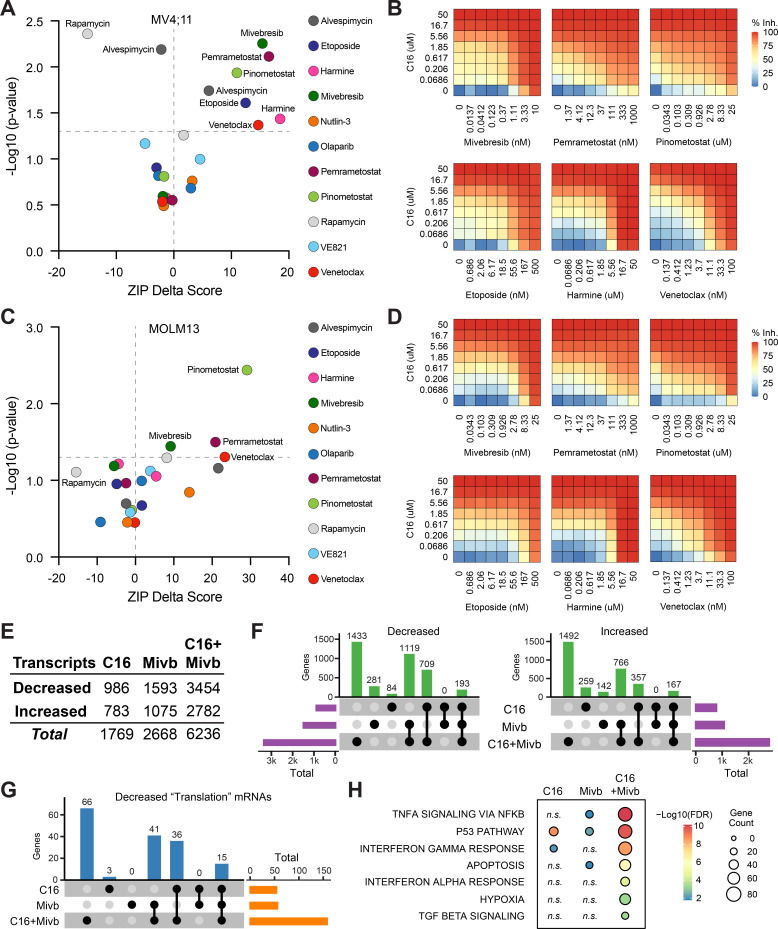
Figure 5. Identification of agents that synergize with WIN site inhibitors (WINi) in MLLr cells.
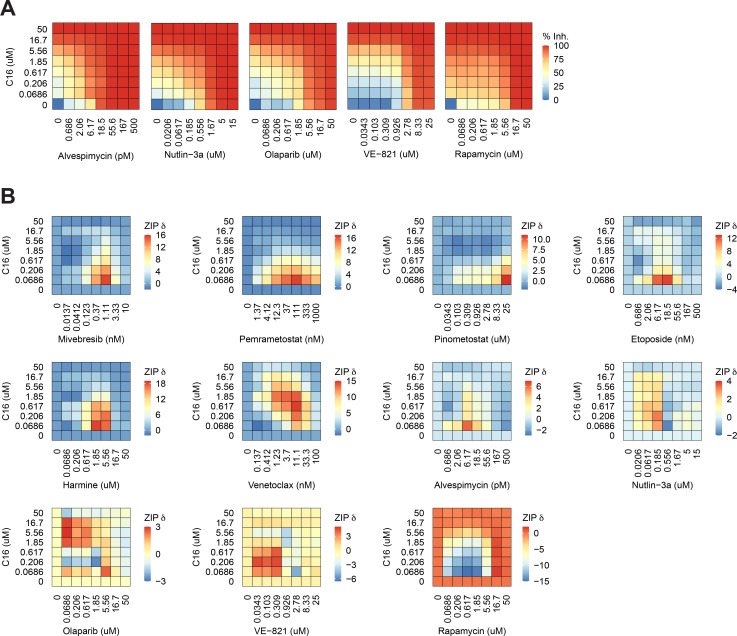
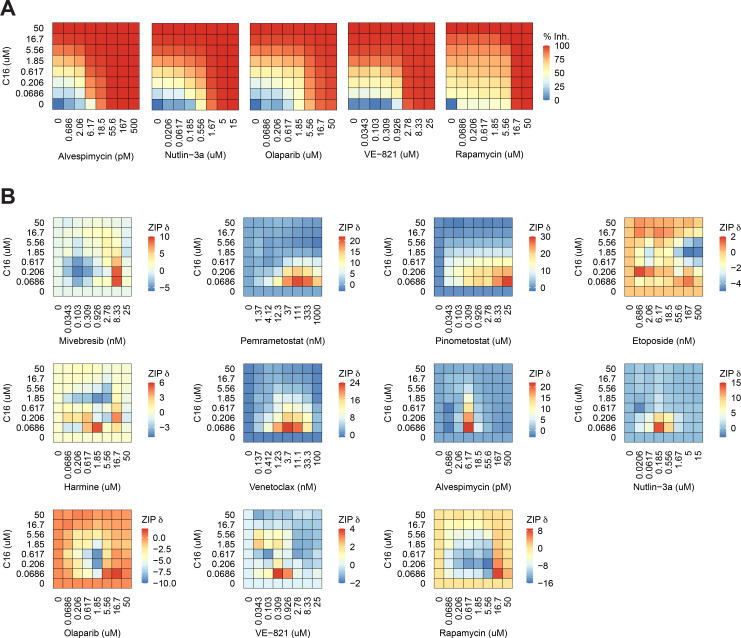
(A) Peak synergy (>0) and antagonism (<0) zero interaction potency (ZIP) delta (δ) scores from synergy assays in which MV4;11 cells were treated for 3 d with 49 unique dose combinations of C16 and the indicated compound of interest (n = 4). See Figure 5—source data 1 for numerical ZIP delta analysis output. (B) Heatmaps of MV4;11 cell growth inhibition at each dose of C16 and the indicated six compounds. The remaining five combinations tested are shown in Figure 5—figure supplement 1. (C) As in (A) but for MOLM13 cells. See Figure 5—source data 1 for numerical ZIP delta analysis output. (D) As in (B) but for MOLM13 cells. The remaining five combinations tested are shown in Figure 5—figure supplement 2. (E) Number of genes with significantly (false discovery rate [FDR] < 0.05) altered transcript levels following treatment of MV4;11 cells with C16 (100 nM), mivebresib (Mibv; 2.5 nM), or the combination for 48 hr, as determined by RNA-seq (n = 3). See Figure 5—source data 2 for complete output of RNA-seq analysis. (F) UpSet plot, showing the overlap of genes suppressed (left) or induced (right) in response to C16, mivebresib, or the combination. (G) UpSet plot, showing the breakdown of Reactome ‘Translation’ pathway genes suppressed in response to C16, mivebresib, or the combination. (H) Enrichment of Reactome Pathways in genes with increased transcripts following treatment of MV4;11 cells with C16, mivebresib, or the combination. See Figure 5—source data 3 for complete output of enrichment analyses.


