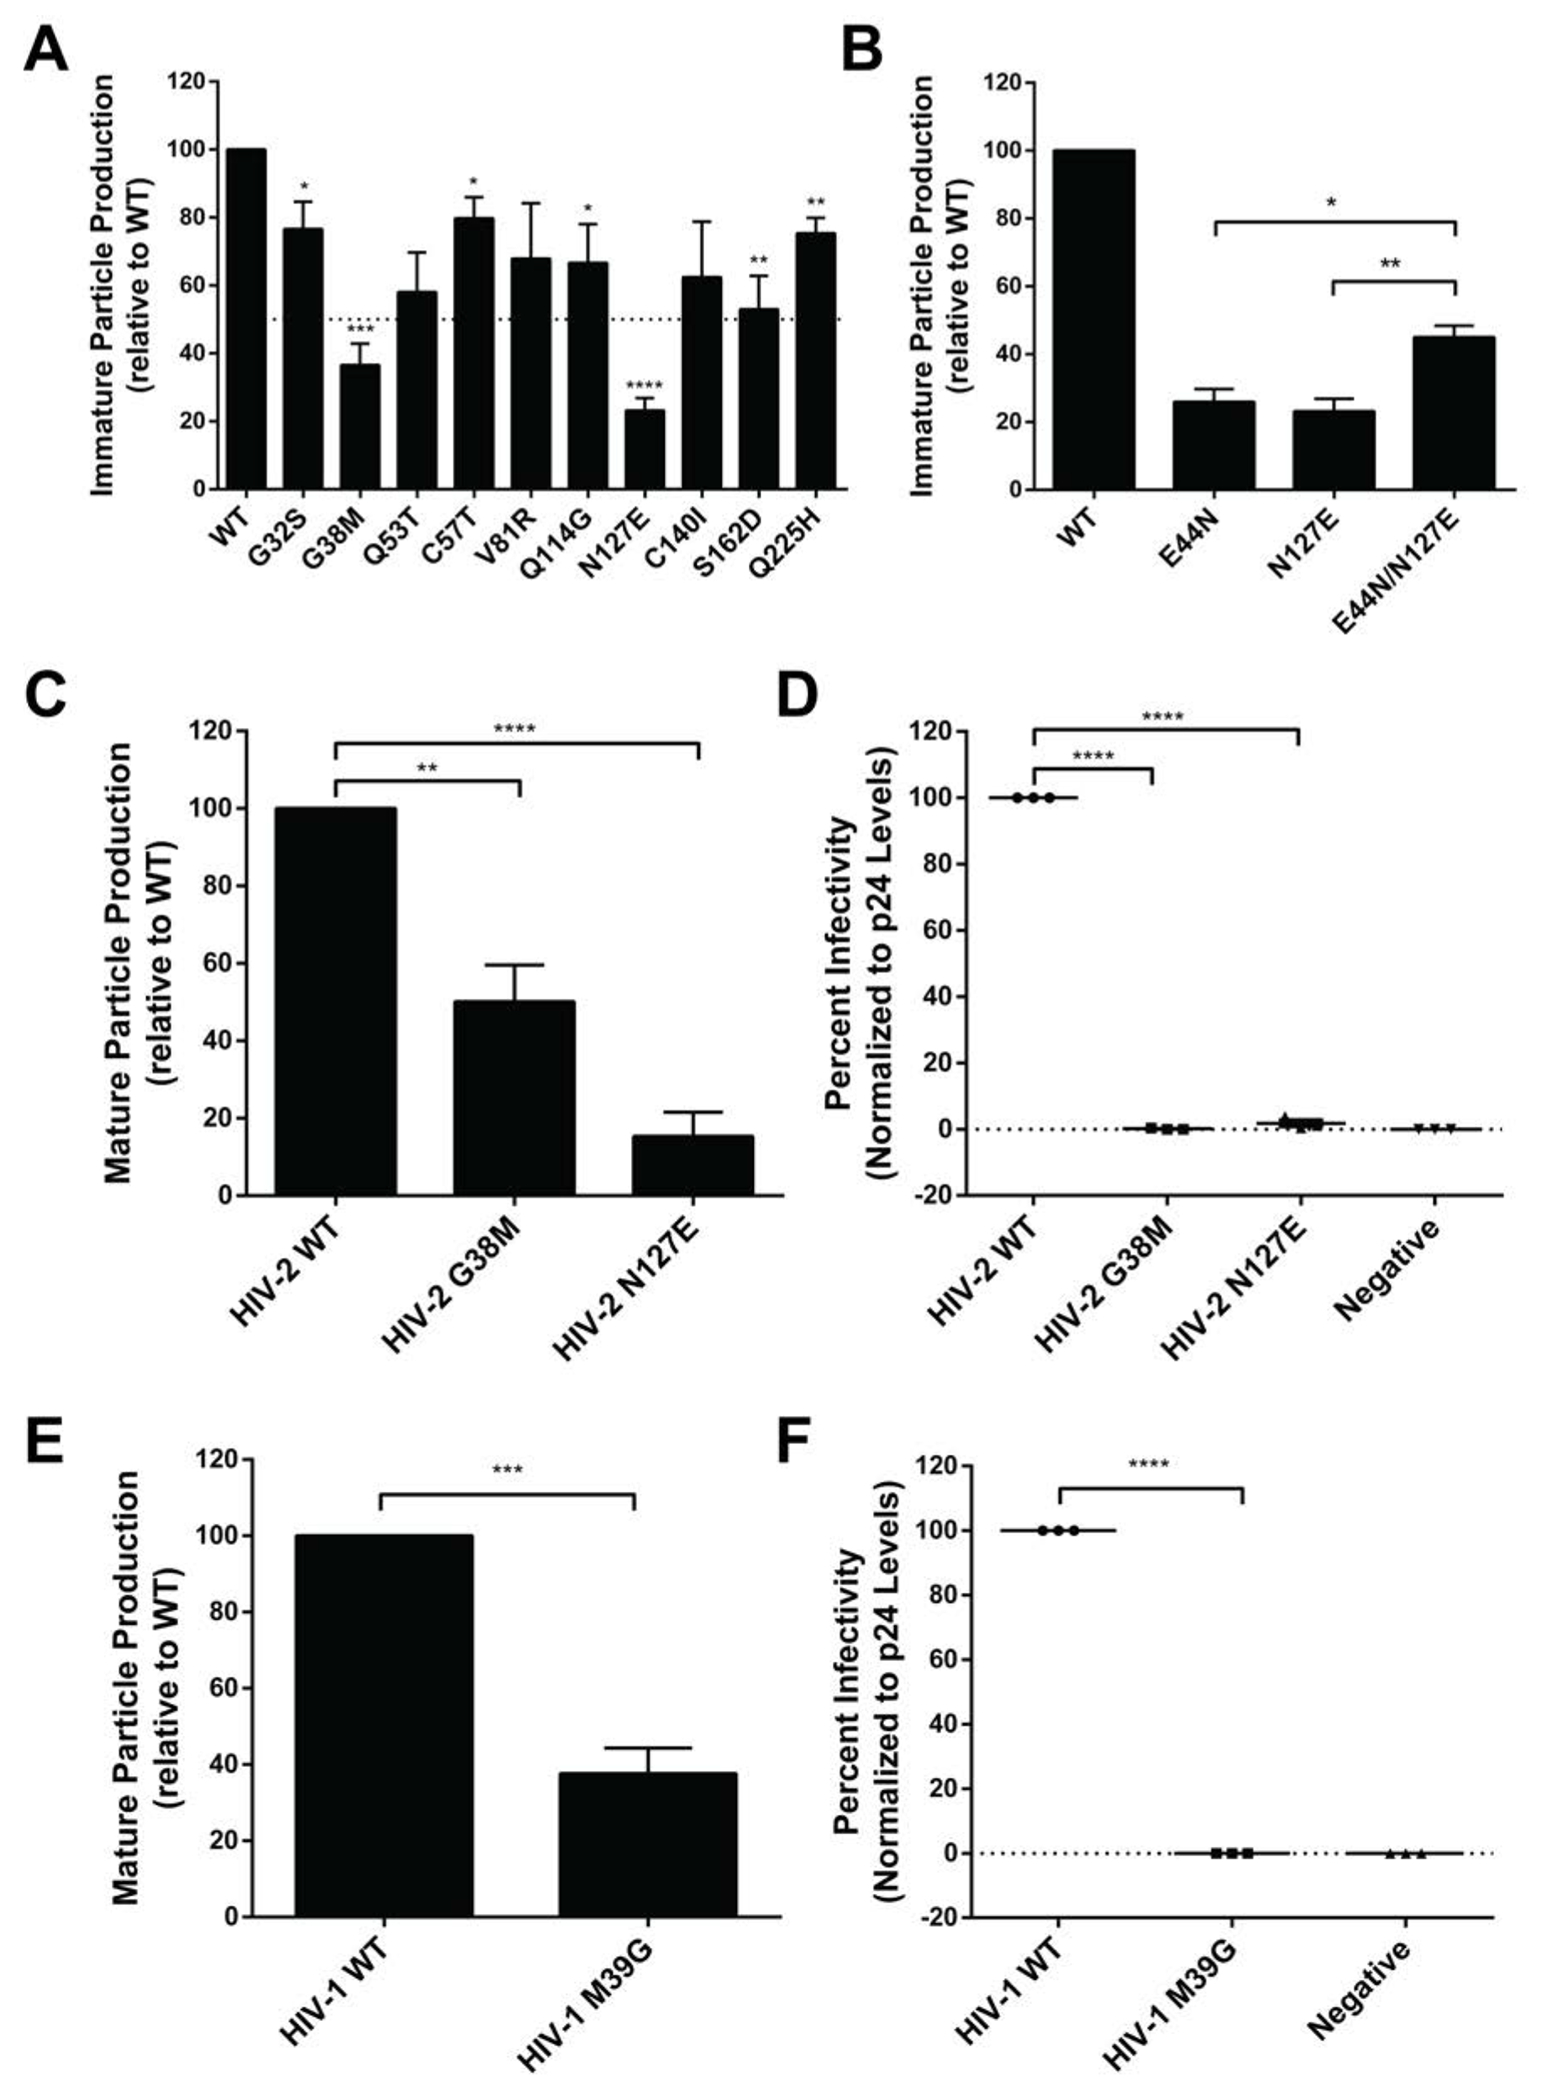
Figure 3. Particle production and infectivity analysis for HIV CA mutants at non-conserved amino acid residues.

(A) Immature particle production of HIV-2 CA mutants at non-conserved amino acid residues. Particle production of mutants from a Gag expression construct was determined by immunoblot analysis relative to that of WT (set at 100). (B) Immature particle production of HIV-2 CA mutants. Shown is particle production of the HIV-2 CA E44N, N127E and E44N/N127E mutants as determined by immunoblot analysis relative to that of WT (set at 100). (C) Mature HIV-2 particle production from a HIV-2 single-cycle vector for selected mutants as determined by immunoblot analysis. Shown is particle production of the HIV-2 G38M and N127E CA mutants relative to that of WT (set at 100). (D) Infectivity of HIV-2 CA mutants. Shown is the infectivity relative to that of WT (set at 100) for the HIV-2 G38M and N127E mutants. (E) Mature particle production from a HIV-1 single-cycle vector of a HIV-1 CA mutant. Shown is mature particle production for the HIV-1 M39G CA mutant relative to that of WT (set at 100). (F) Infectivity analysis of a HIV-1 CA mutant. Immunoblot analysis of CA p24 levels was conducted to determine the amount of particle production for the M39G mutant relative to that of the WT HIV-1 single-cycle vector. Virus particle infectivity was determined by flow cytometry analysis of infected cells that express a fluorescence reporter gene from the integrated HIV-1 provirus. Mutant particle infectivity was relative to that of the WT HIV-1 vector virus and was normalized to CA p24 levels. Error bars represent standard deviations from three independent experiments. Significance relative to WT was determined by an unpaired t test. ****, P < 0.0001; ***, P < 0.001; **, P < 0.01; *, P < 0.05. Representative immunoblot images are shown in Supplemental Figure S2.
