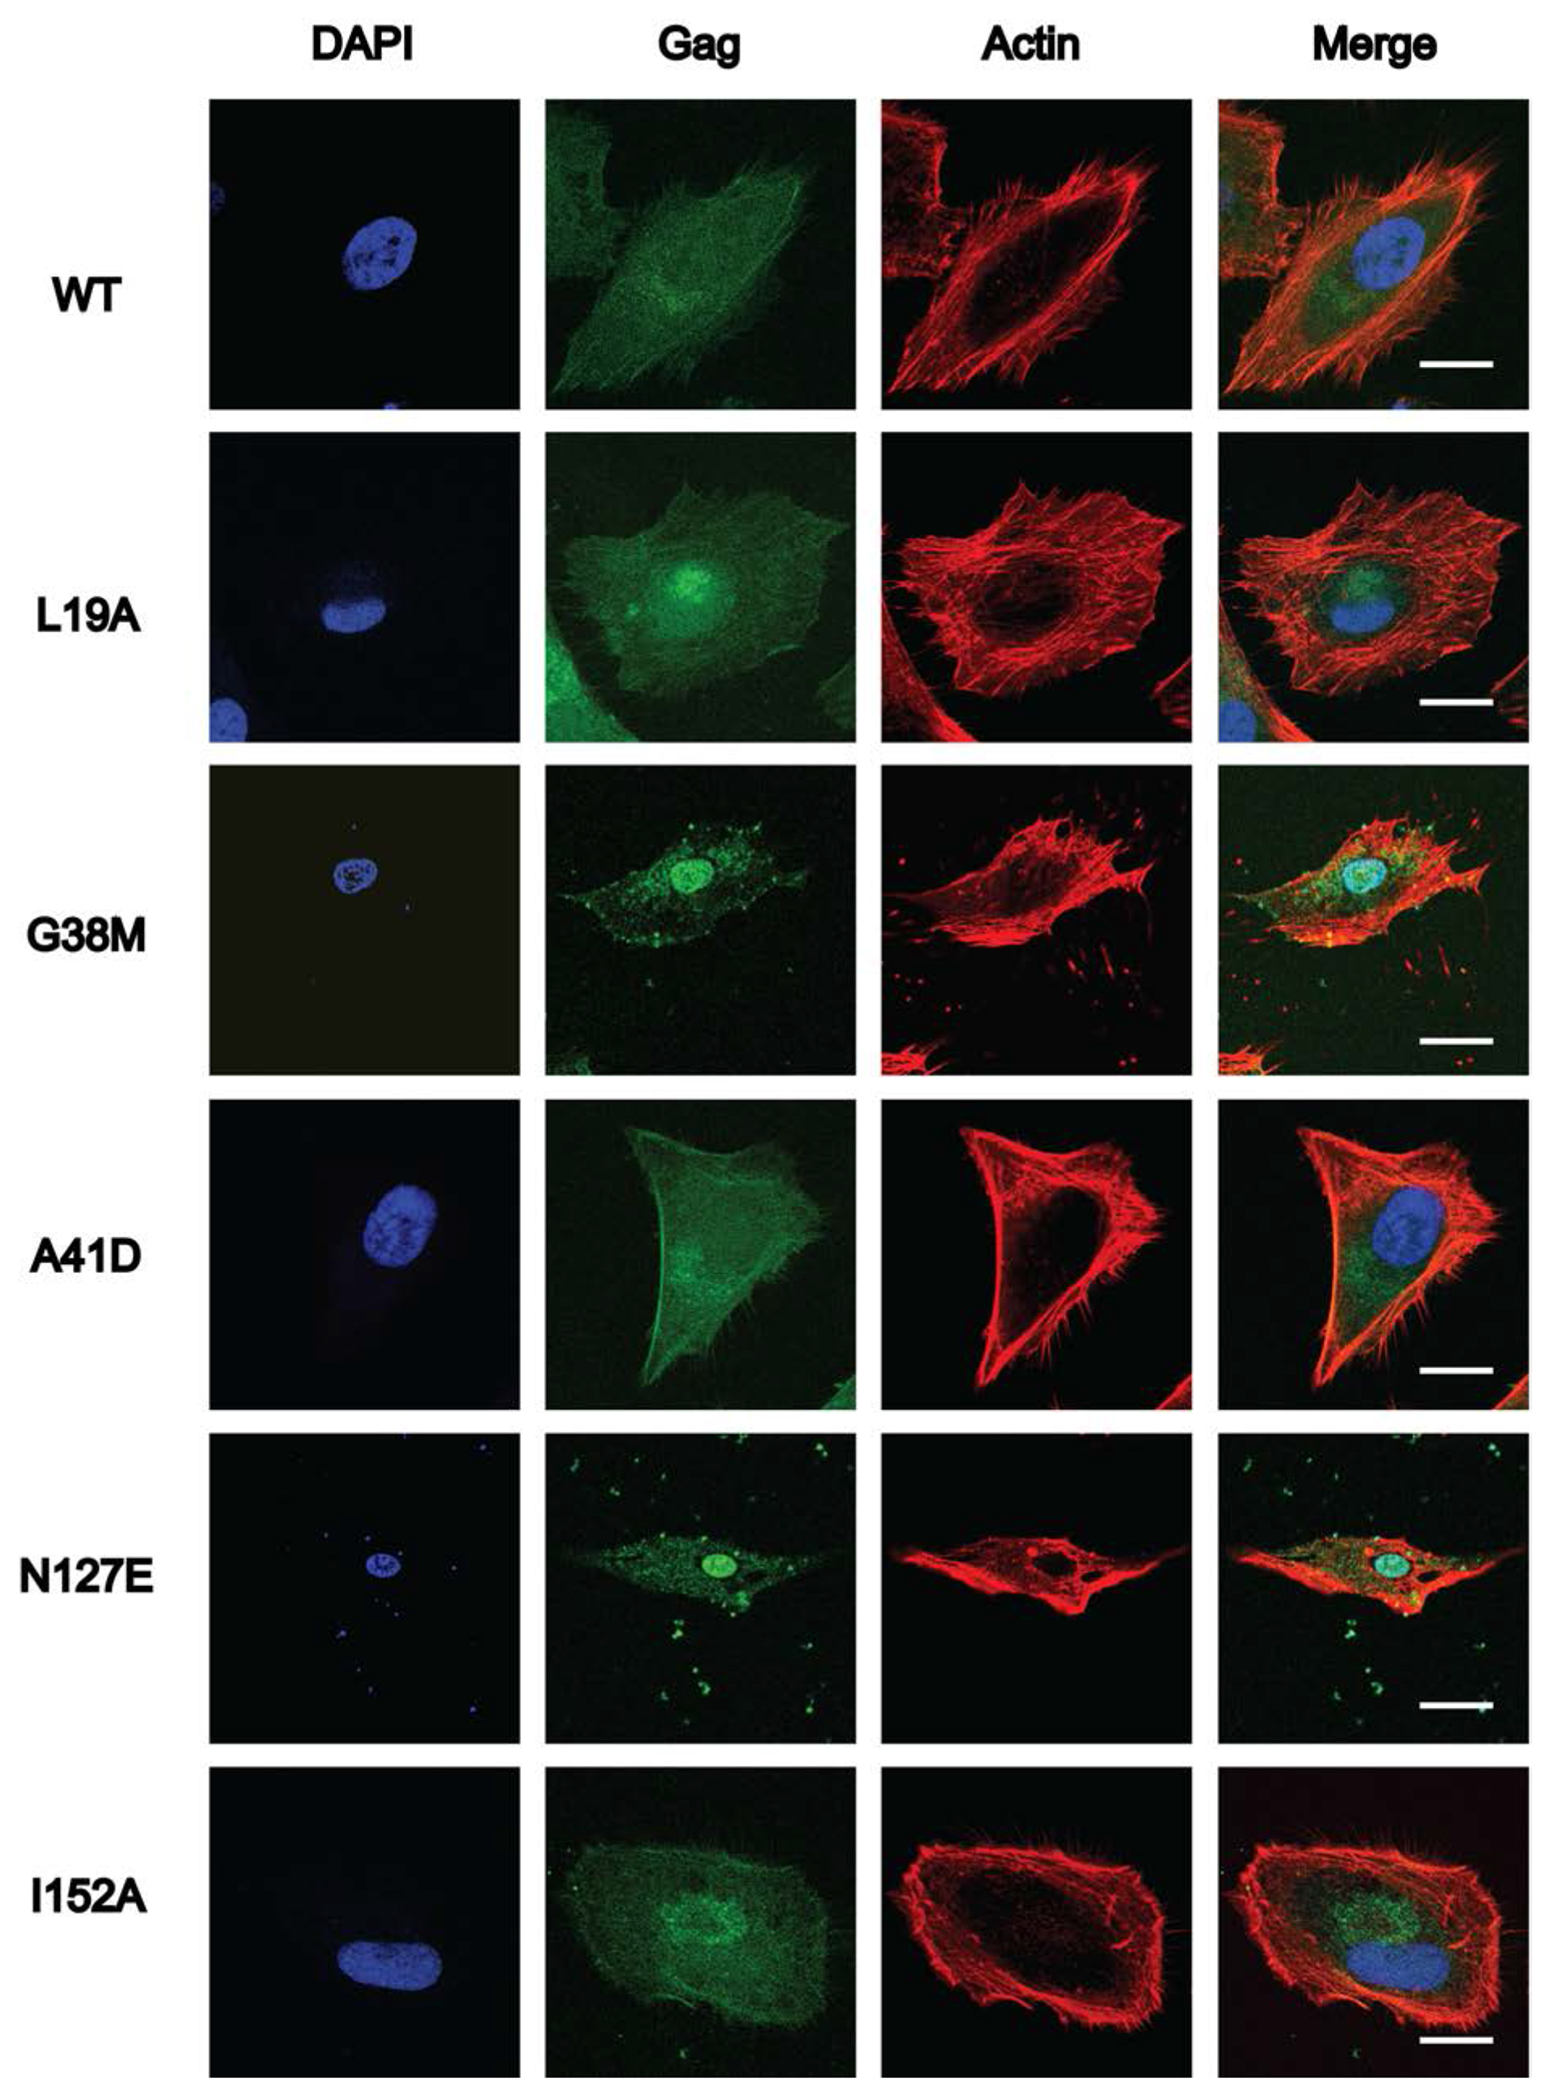
Figure 4. Subcellular localization of HIV-2 WT Gag and selected CA domain mutants.

HeLa cells were transfected with either HIV-2 Gag-eYFP or a site-directed Gag CA domain mutant. Representative images for WT HIV-2 Gag-eYFP and each Gag CA domain mutant (i.e., L19A, G38M, A41D, N127E and I152A) are shown. At least 15 individual cells were imaged across three independent replicates for a total of 15 cells. Scale bar, 20 μm. Nuclei (blue; stained with DAPI), Gag (green) localization; actin (red, stained with actin red) are indicated, and the merged composite is shown.
