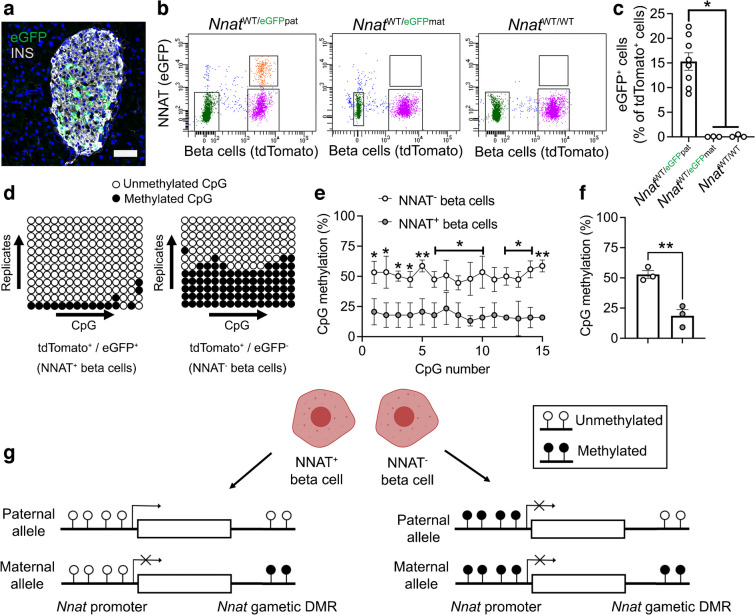
Fig. 5.
Beta cell heterogeneity of NNAT expression is associated with changes in CpG methylation at the Nnat promoter. (a) Representative confocal microscopy of pancreatic cryosections from P56 mice with Nnat-driven eGFP expression from the paternal allele (NnatWT/eGFPpat) (n=7 mice). Sections were immunostained with antibodies against eGFP (green) and insulin (INS, grey). Nuclei are visualised with DAPI. Scale bar, 50 μm. (b) FACS separation of dispersed primary islet cells from reporter mice with insulin-driven expression of tdTomato (to label beta cells) and Nnat-driven eGFP expression from the paternal (NnatWT/eGFPpat) or maternal (NnatWT/eGFPmat) allele or wild-type (NnatWT/WT) at this locus (representative FACS plot of the dispersed islet preparation from a single mouse shown) (n=8, 3 and 3 mice per genotype, respectively, Kruskal–Wallis test with Dunn’s multiple comparisons). (c) Quantification of data in (b) expressed as percentage of eGFP/tdTomato co-positive primary islet cells. (d) Representative bisulphite analysis of CpG methylation at the Nnat promoter in FACS-purified islet cell populations from (b) (n=3 NnatWT/eGFPpat mice with paternally expressed Nnat-driven eGFP, n≥12 clones each). Closed circles, methylated CpG; open circles, unmethylated CpG. (e, f) Quantification of data in (d) expressed as percentage CpG methylation across the Nnat promoter at individual CpGs (e) and across the entire Nnat promoter (f) (both paired Student’s t test). (g) Schematic summarising level of CpG methylation at the Nnat promoter and gametic DMR in NNAT+ vs NNAT− beta cells (created with BioRender.com). Representative image in (a) and bisulphite analyses in (d) used experimental mice from three independent experiments and breeding pairs. *p<0.05, **p<0.01

