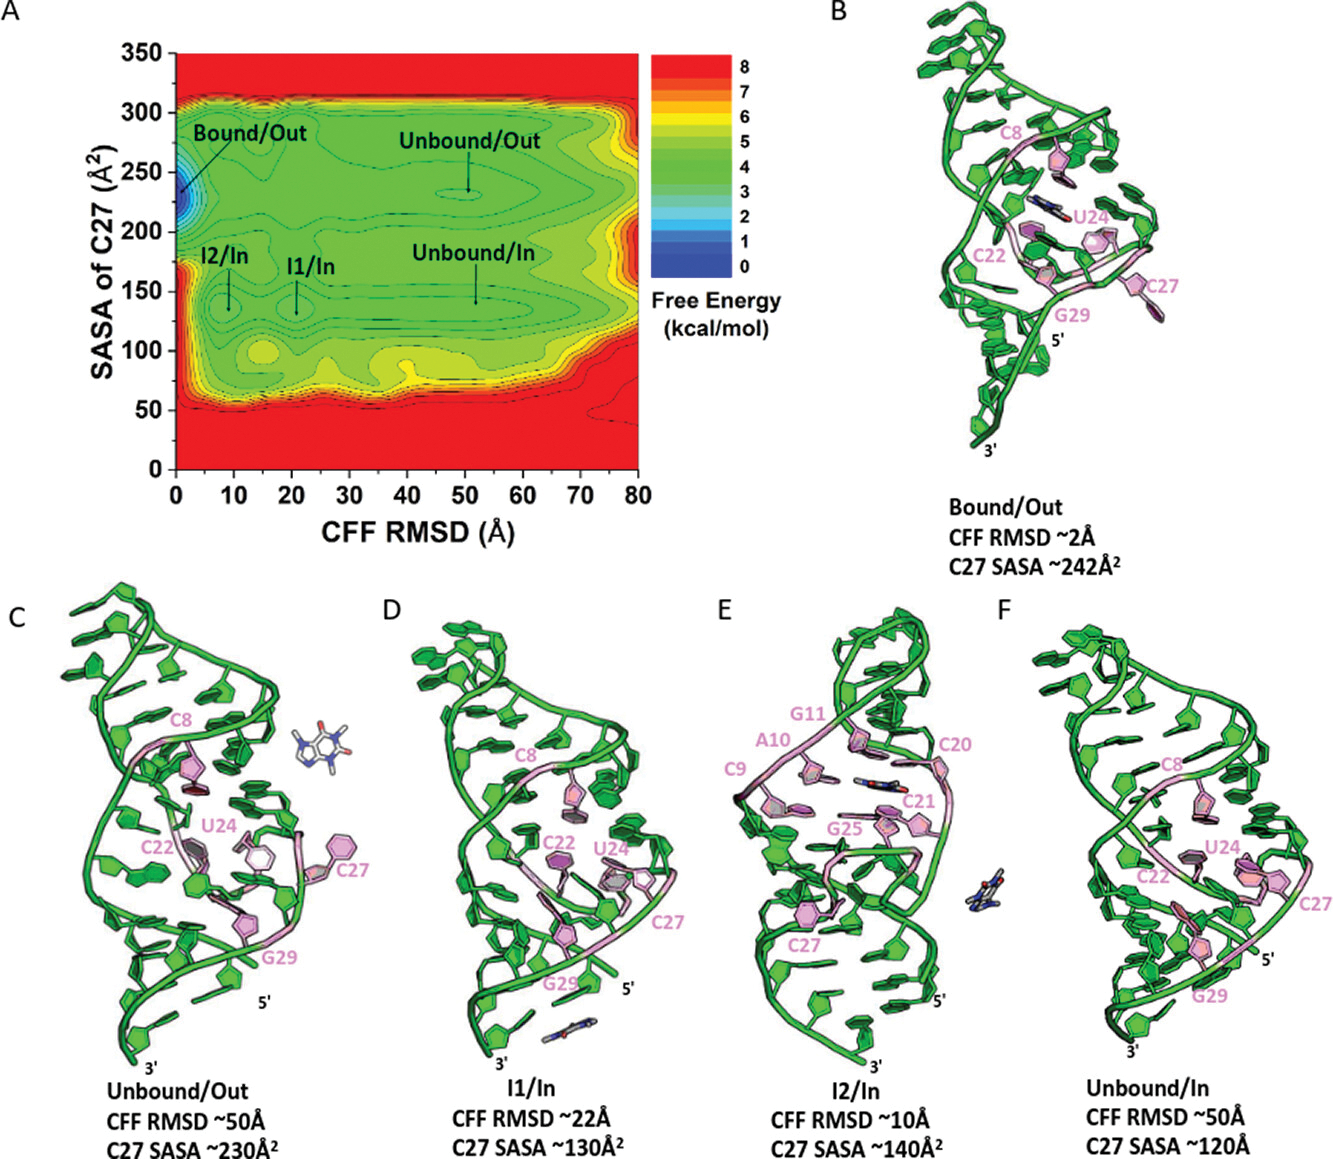
Figure 5.

Free energy profiles and low-energy conformational states of CFF binding to RNA aptamer: (A) 2D PMF energy profile regarding the CFF RMSD (relative to its bound pose in the starting structure) and Solvent Accessible Surface Area (SASA) of nucleotide C27 (B–F) Low-energy states as identified from the 2D free energy profile (B) “Bound/Out”, (C) “Unbound/Out”, (D) “I1/In”, (E) “I2/In”, and (F) “Unbound/In” states. The RNA is presented in cartoons in green and the ligand in sticks with the C atoms colored in gray. The C8, C22, U24, C27, and G29 nucleotides are highlighted in light pink. The 5′ and 3′ termini are indicated for the RNA aptamer.
