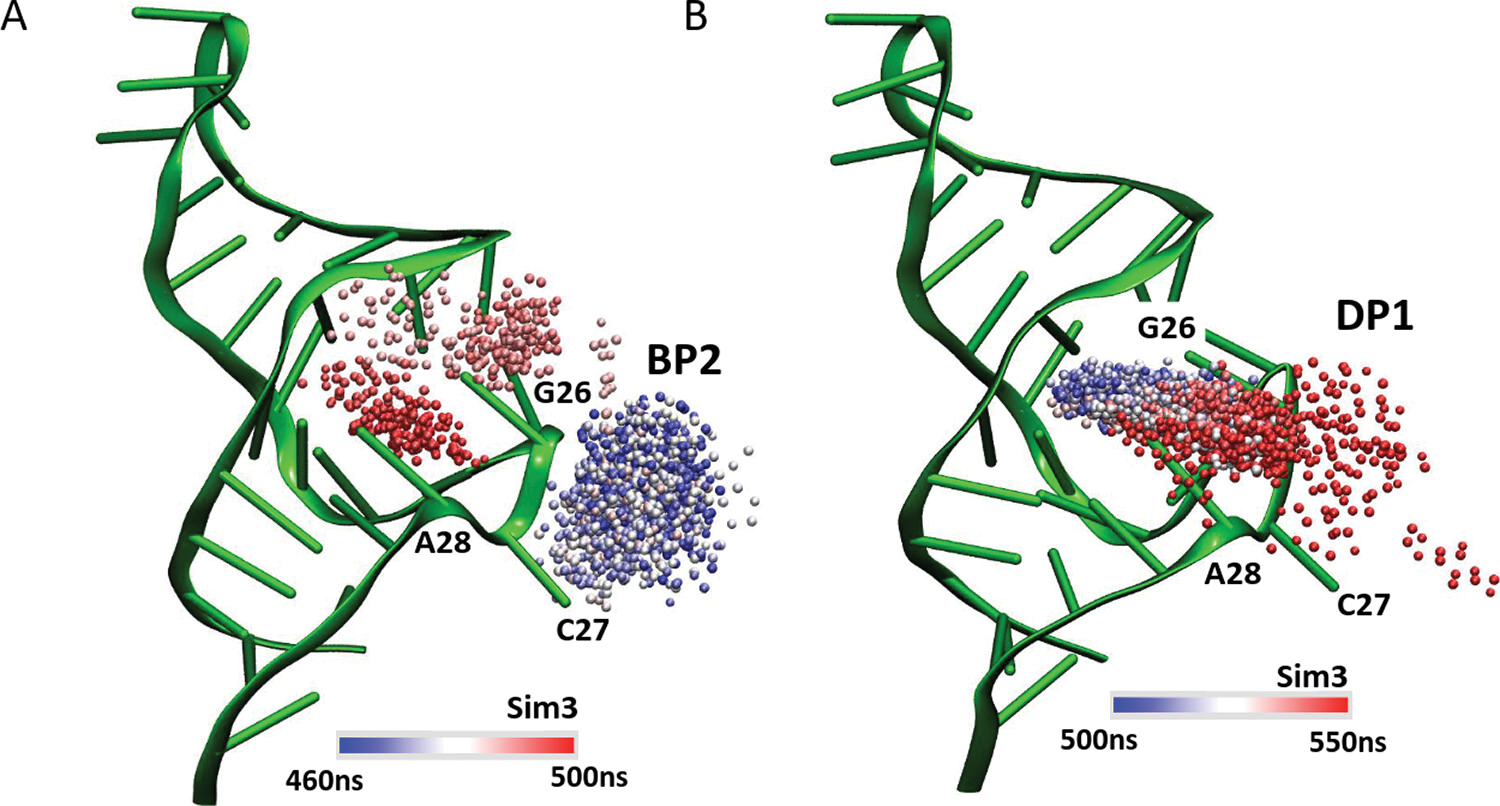
Figure 7.

Representative binding and dissociation pathway of caffeine to the RNA aptamer revealed from LiGaMD: (A) “Sim3” captured CFF binding in the pocket, starting from outside in the solvent as it approaches inward, shown with bead trace in colored simulation time in a blue-white-red (BWR) color scale, labeled as binding pathway 2, “BP2”. (B) “Sim3” captures caffeine dissociation from the binding pocket, trace represented in a blue-white-red (BWR) color scale, labeled as Dissociation Pathway 2 or “DP2”.
