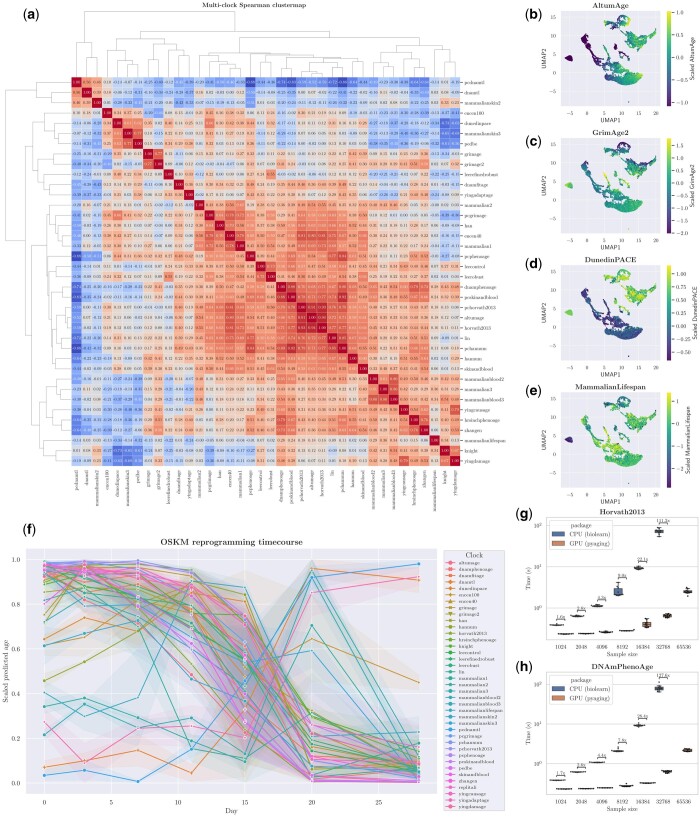
Figure 1.
Four simple analyses with pyaging. (a) Heatmap showing Spearman’s correlation amongst 38 methylation clocks in AltumAge’s dataset. Clocks are grouped by hierarchical clustering. (b–e) UMAP plot of the top five principal components from the scaled data matrix of 38 different clocks for AltumAge’s data, highlighting AltumAge (b), GrimAge2 (c), DunedinPACE (d), and MammalianLifespan (e). (f) Line plot of 39 different clocks for the reprogramming timecourse dataset GSE54848; 95% confidence intervals are derived from 1000 bootstraps. (g, h) Performance comparison between GPU-enabled age prediction with pyaging versus CPU-only biolearn using Horvath2013 and DNAmPhenoAge. Ten random samples of size n from AltumAge’s data were taken to construct the boxplots. Predictions for the 65 536-sample setting for was not computed for biolearn due to memory issues.

