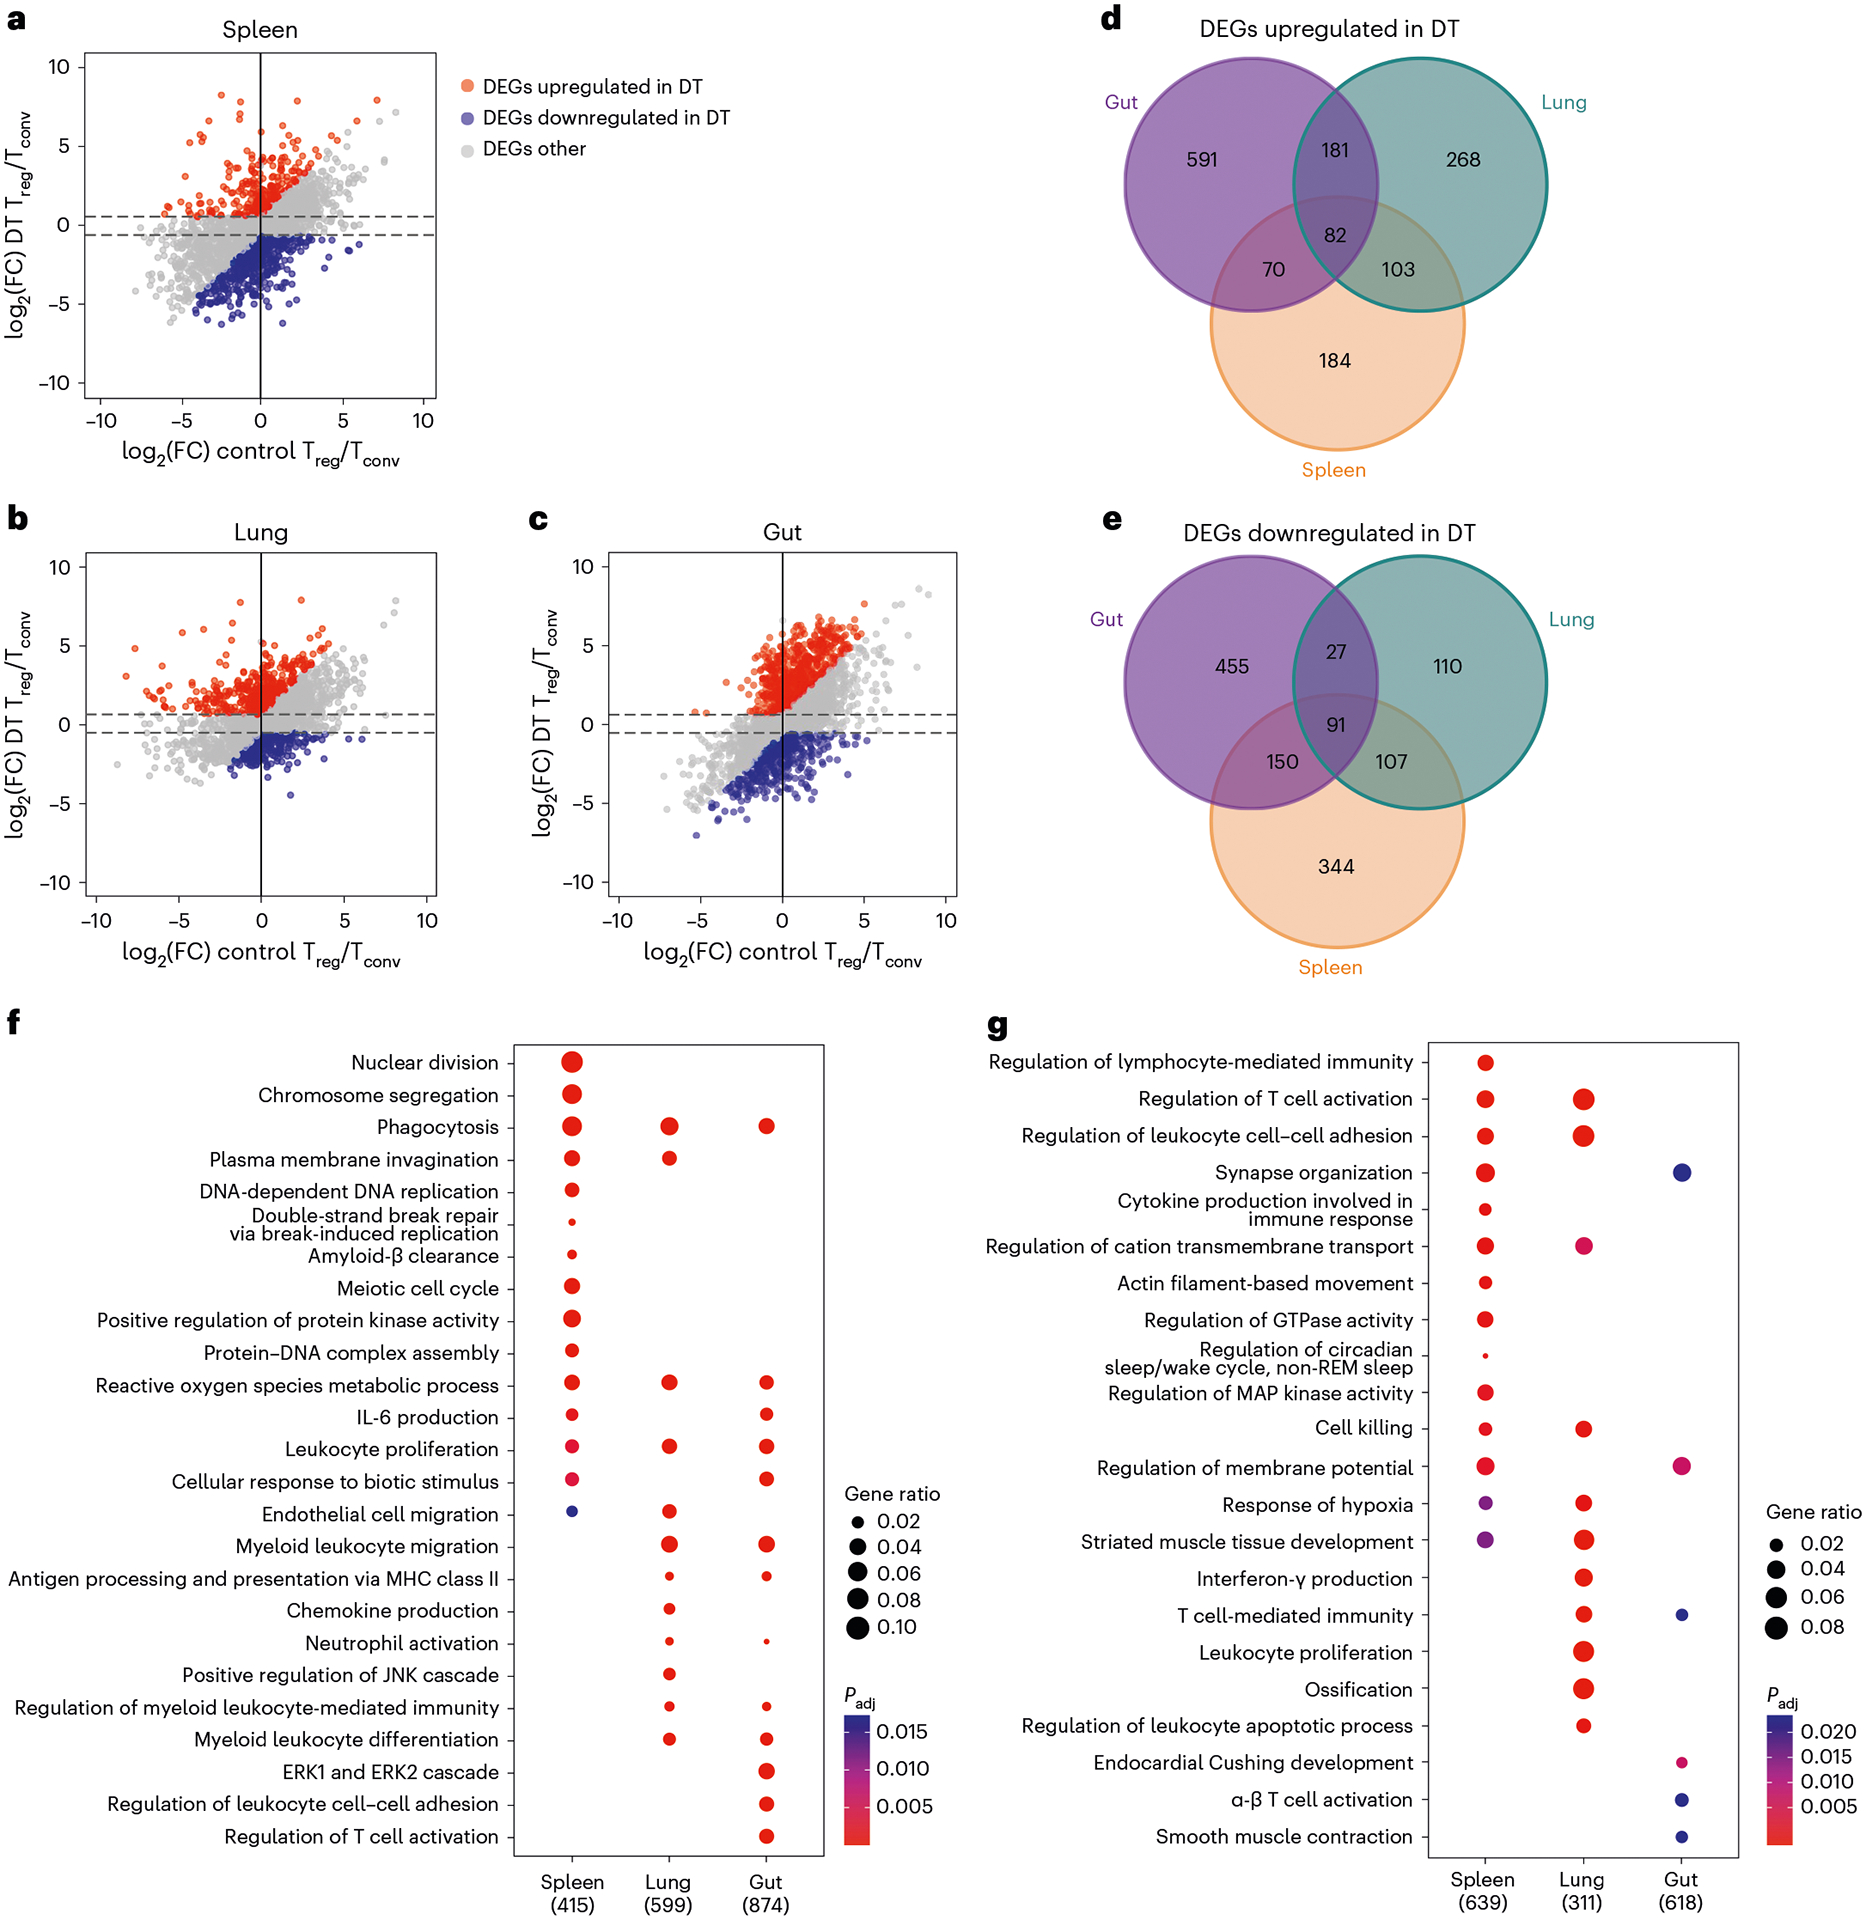
Fig. 1 |. Transcriptomic analysis of tissue Treg cells during active suppression of local inflammatory responses.

a–c, Scatter plots depicting log2(fold-change) (log2(FC)) of gene expression in spleen (a), lung (b) and gut (SI LP) (c) of Treg cells over Tconv cells in DT-treated mice versus those in PBS-treated controls. Genes that are upregulated under DT-treated condition (false discovery rate (FDR) <5% and the value of log2(FC) > 0.585 (1.5-fold) and at least 0.585 higher than the value of log2(FC) under the PBS-treated control condition). Genes are downregulated under the DT-treated condition (FDR < 5% and the value of log2(FC) < −0.585 and at least 0.585 lower than the value of log2(FC) under the PBS-treated control condition). d,g, Venn diagrams demonstrating genes upregulated (d) or downregulated (e) in different tissue-specific Treg cells from DT-treated mice. Numbers represent gene numbers. f,g, Dot plot of GO term enrichment analysis of DEGs upregulated (f) or downregulated (g) in tissue Treg cell subsets. MHC, Major histocompatibility complex; REM, rapid eye movement. Colors indicate the P values from Fisher’s exact test and dot size is proportional to the number of DEGs in a given biological process.
