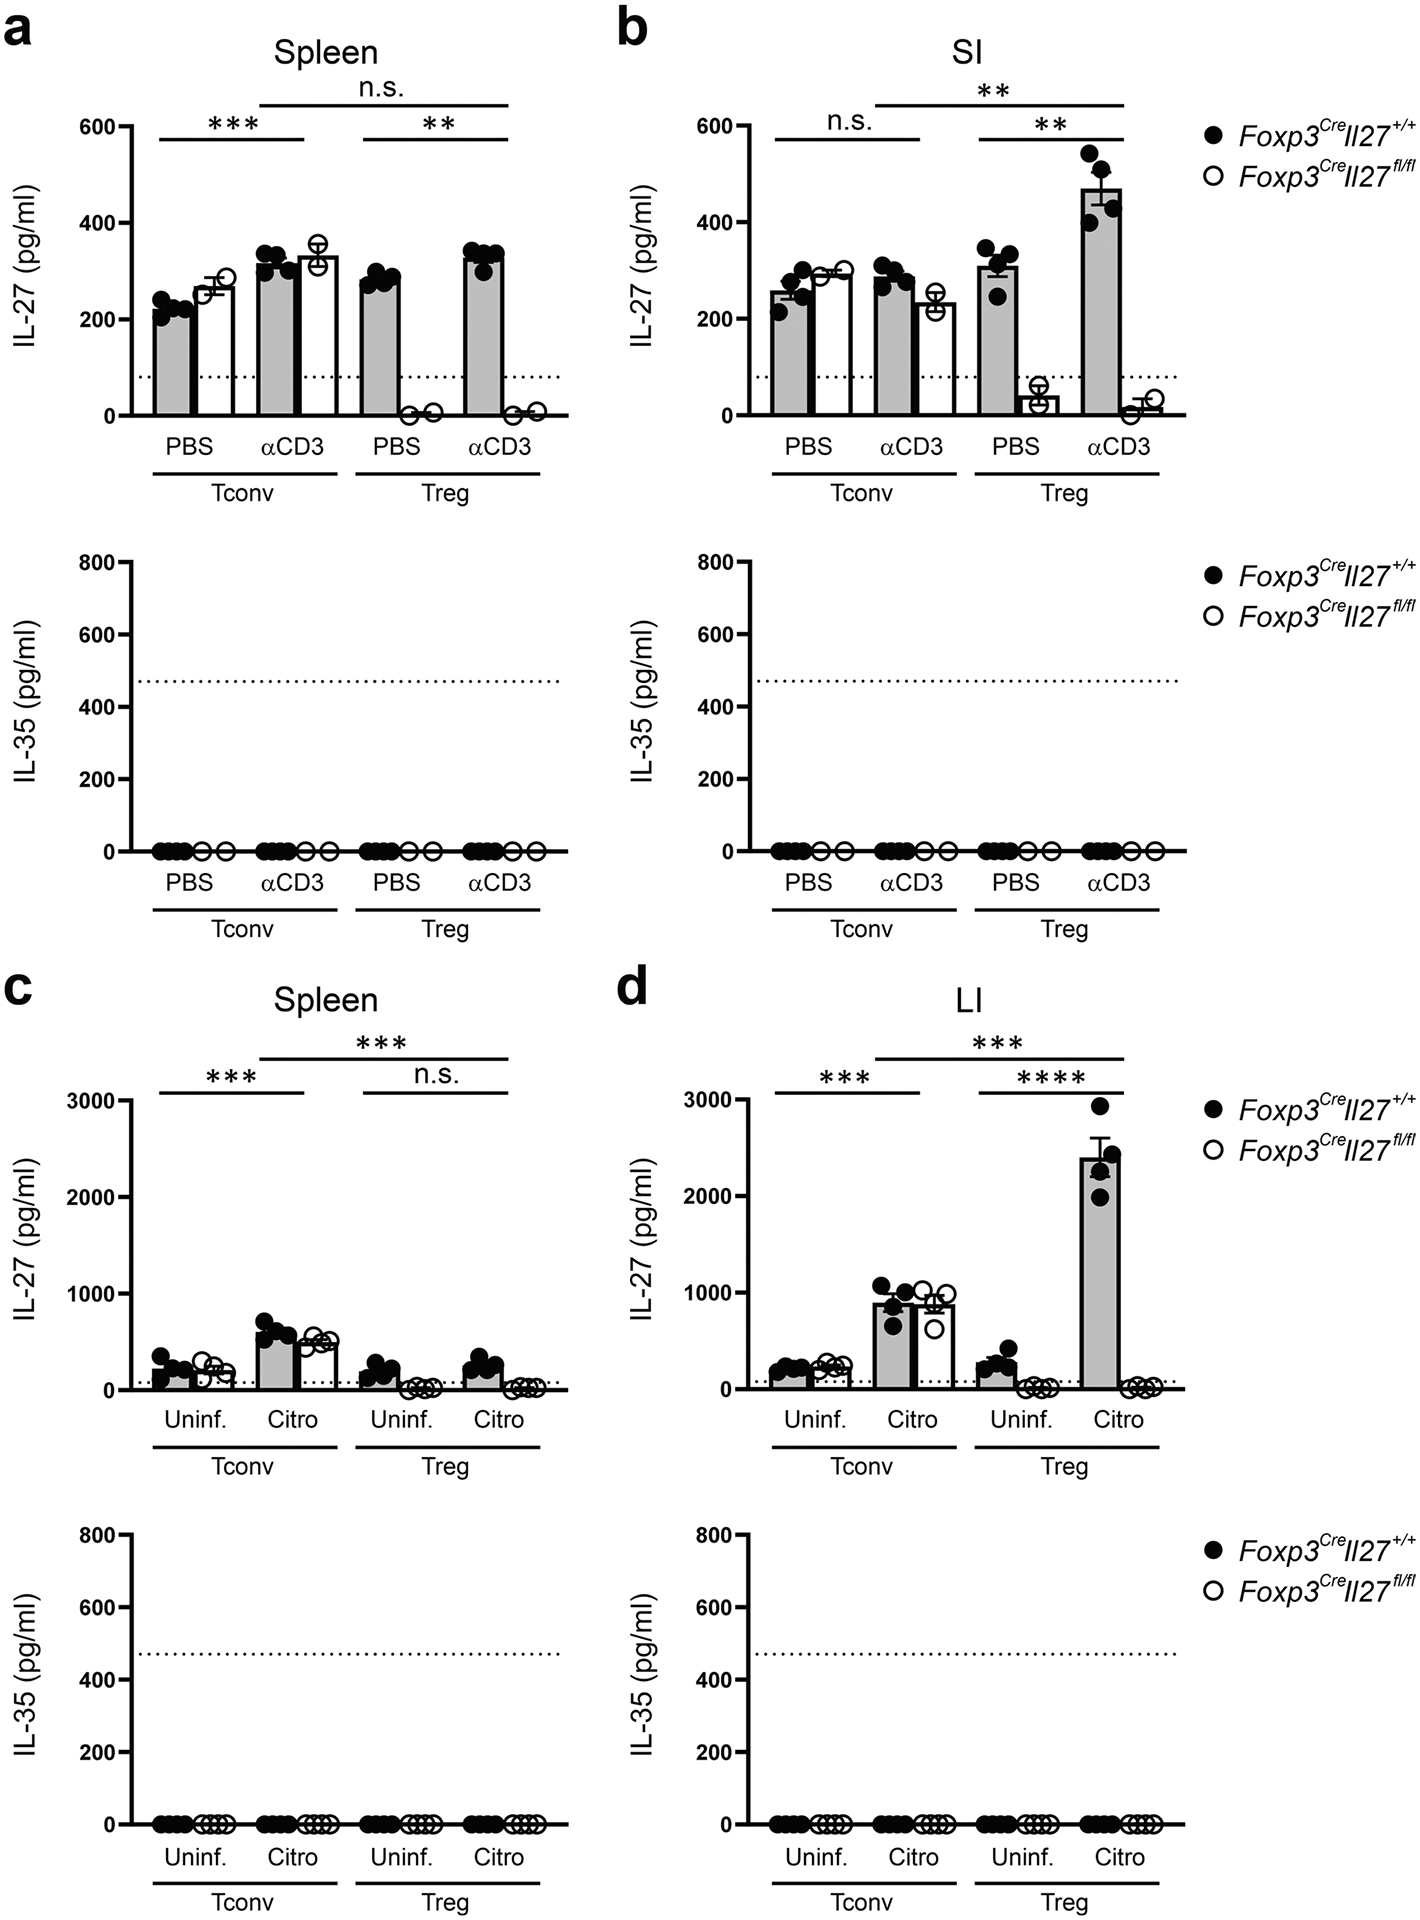
Extended Data Fig. 6 |. Elevated IL-27 production by intestinal Treg cells could be observed in other autoimmune- and infection-driven inflammatory settings.

ELISA analyses of the production of IL-27 or IL-35 by Tconv and Treg cells in a, spleen and b, SI LP from PBS or aCD3 mAb treated Foxp3CreIl27fl/fl mice and WT littermates. Each symbol represents FACS-isolated cell sample pooled from two to three mice (n = 4 for Foxp3CreIl27+/+; 2 for Foxp3CreIl27fll/fl). ELISA analyses of the production of IL-27 or IL-35 by Tconv and Treg cells in c, spleen and d, LI LP from Foxp3CreIl27fl/fl mice and WT littermates at day 10 post C. rodentium infection. Each symbol represents FACS-isolated cell sample pooled from two to three mice (n = 4). Dotted line represents the minimum detection limit of the indicated cytokine. Data are presented as mean values +/− SD. In a, n.s. = 0.4560 (top); ***P = 0.0003 (bottom left); **P = 0.0090 (bottom right). In b, **P = 0.0021 (top); n.s. = 0.2264 (bottom left); **P = 0.0074 (bottom right). In c, ***P = 0.0005 (top), ***P = 0.0010 (bottom left), n.s. = 0.2535 (bottom right). In d, ***P = 0.0005 (top), ***P = 0.0003 (bottom left), ****P < 0.0001 (bottom right). Statistical significance was determined by two-tailed unpaired t test.
