
Fig. 2 |. Identification of IL-27 not IL-35 as a potential suppressor molecule specifically produced by intestinal Treg cells under autoimmune inflammation.
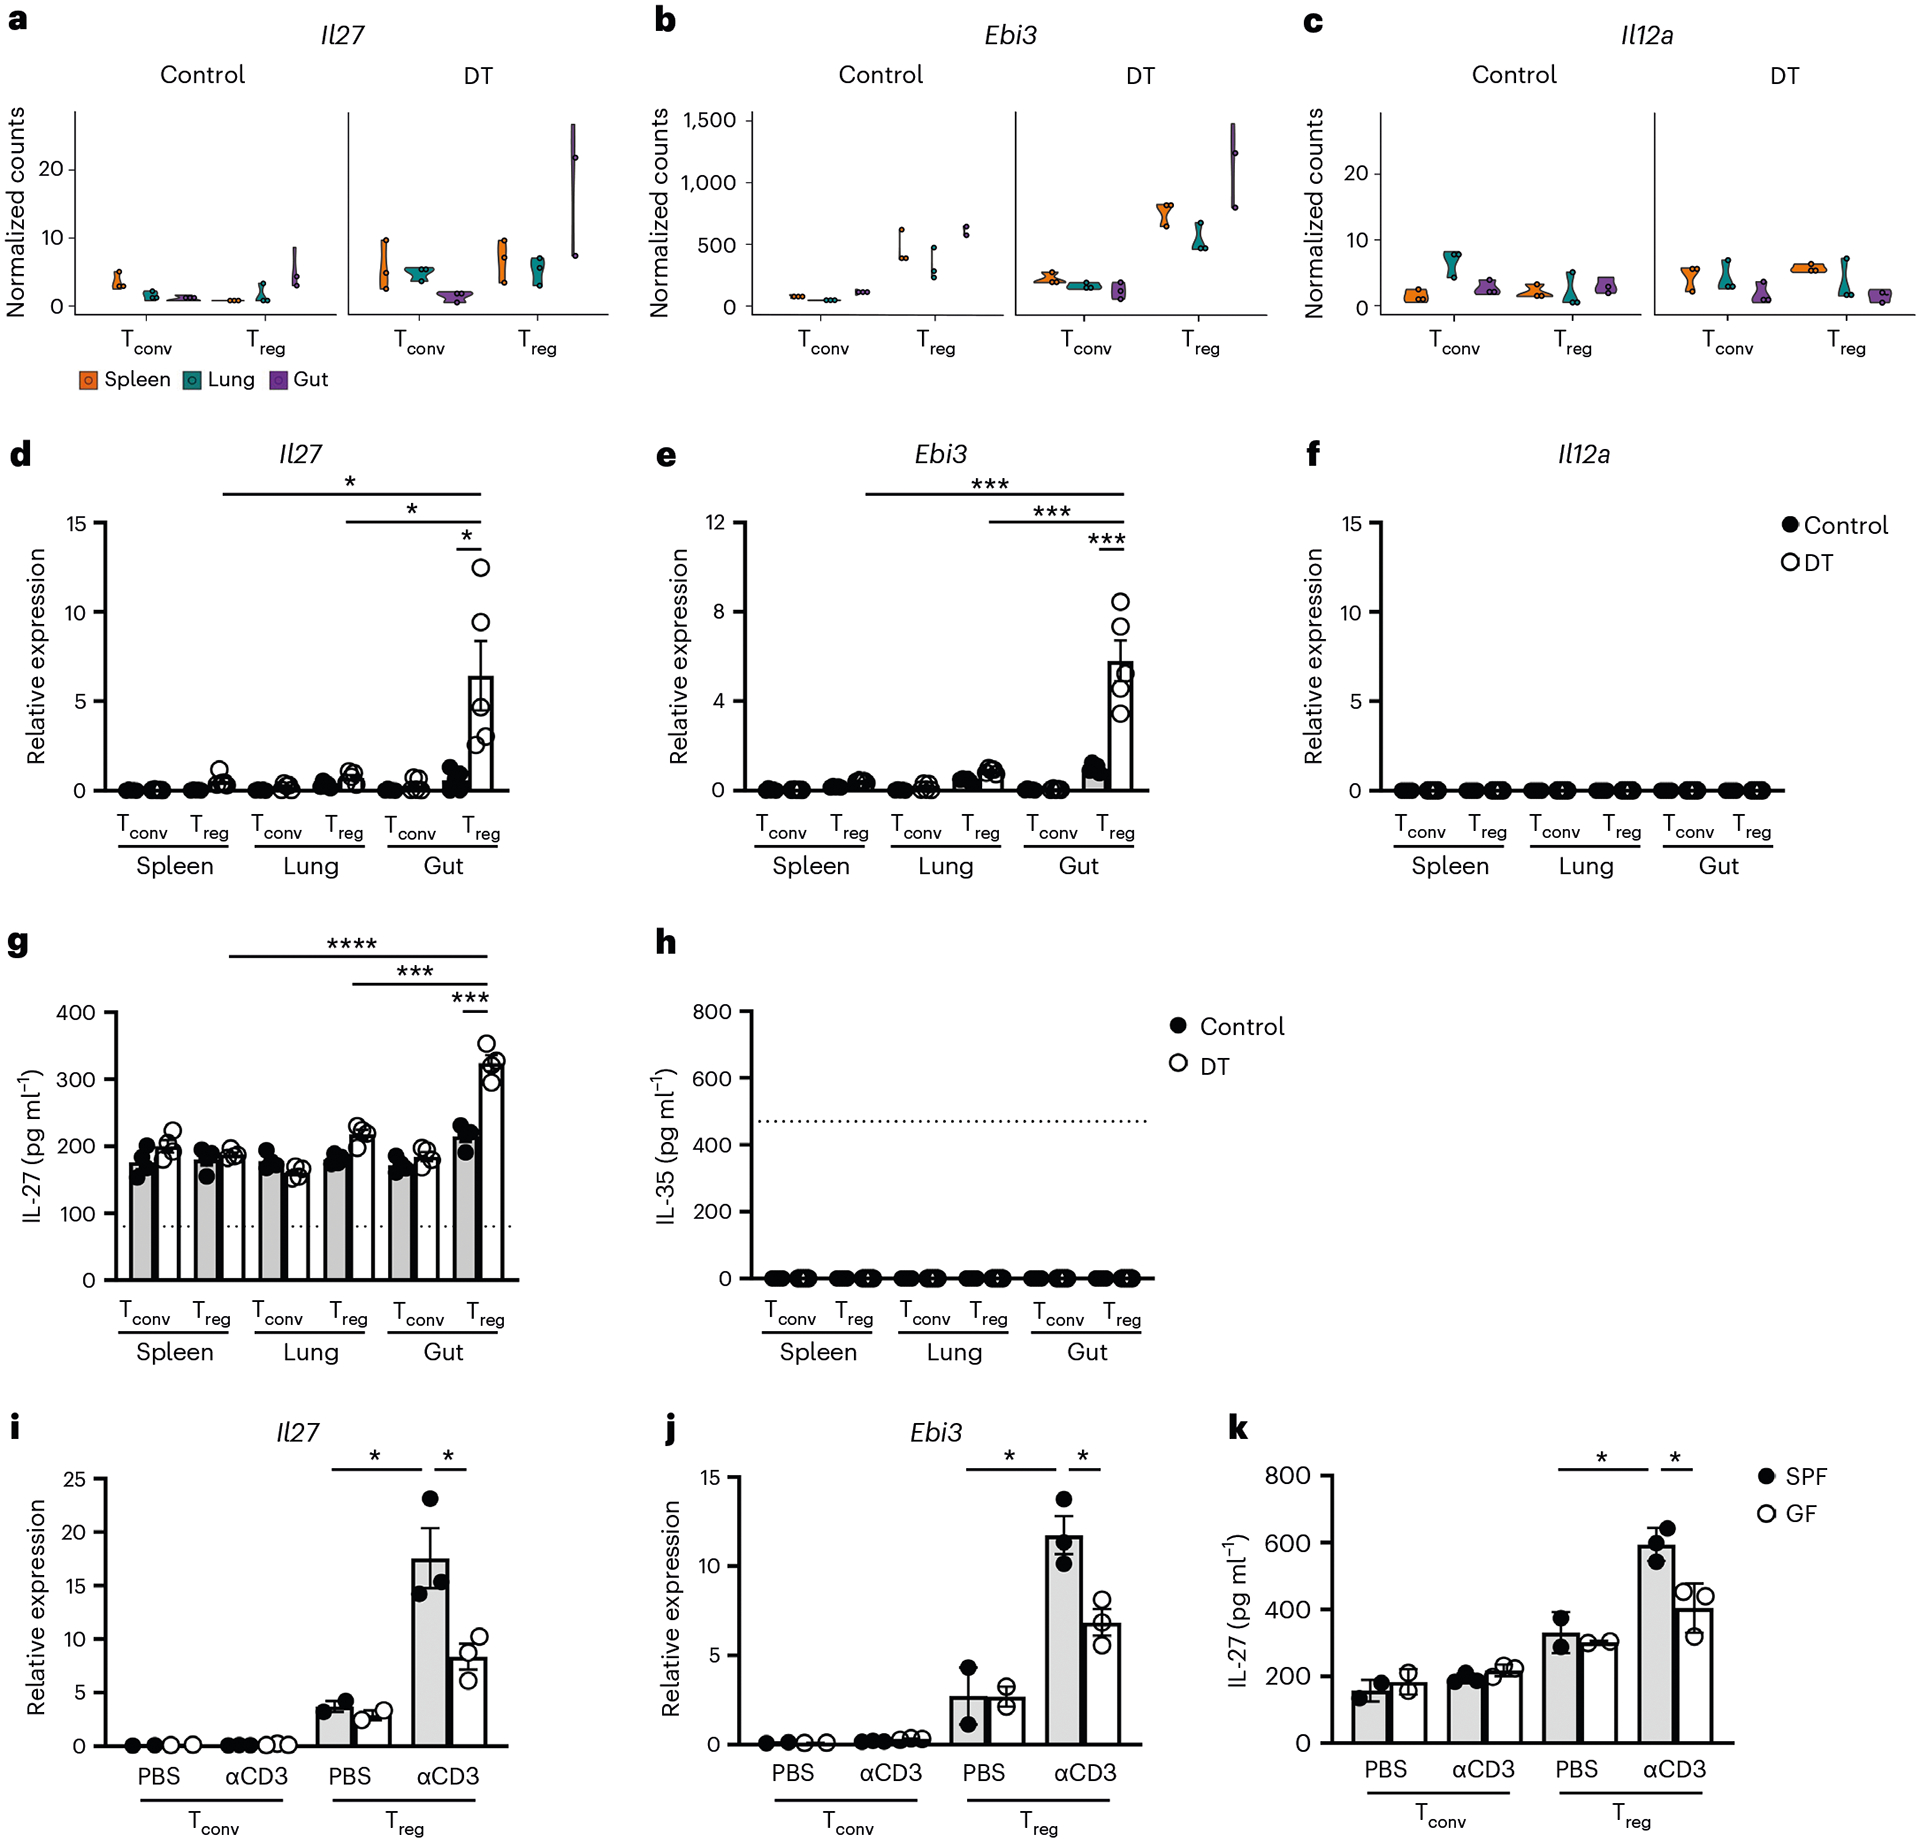
a–c, Violin plots of Il27 (a), Ebi3 (b) and Il12a (c) in Tconv and Treg cells in different tissues from control PBS- or DT-treated Foxp3DTR mice by RNA-seq analysis. d–f, The qPCR analyses for the expression of Il27 (d), Ebi3 (e) and Il12a (f) in Tconv and Treg cells in different tissues from control PBS- or DT-treated mice. Each symbol represents an individual mouse (n = 5). g,h, ELISA of the production of IL-27 (g) or IL-35 (h) by Tconv and Treg cells in different tissues from control PBS- or DT-treated mice. i,j, The qPCR analyses for the expressions of Il27 (i) and Ebi3 (j) in Tconv and Treg cells in SI from control PBS- or aCD3−-treated SPF or GF mice. Each symbol represents a FACS-isolated cell sample pooled from two to three mice (n = 4). k, ELISA analyses of the production of IL-27 by Tconv and Treg cells in SI LP from control PBS- or aCD3 monoclonal antibody-treated SPF and GF mice. Each symbol represents a FACS-isolated cell sample pooled from two to three mice (n = 2 for SPF and 3 for GF). The dotted line represents the minimum detection limit of the indicated cytokine. The data are presented as mean values ± s.d. In d, *P = 0.0164 (up), 0.0187 (middle) and 0.0173 (bottom). In e, ***P = 0.0004 (up), 0.0007 (middle) and 0.0008 (bottom). In g, ****P < 0.0001 (top), 0.0003 (middle) and 0.0003 (bottom). In i, *P = 0.0351 (left) and 0.0394 (right). In j, *P = 0.0467 (left) and 0.0193 (right). In k, *P = 0.0413 (left) and 0.0207 (right). Statistical significance was determined using a two-tailed, unpaired Student’s t-test.