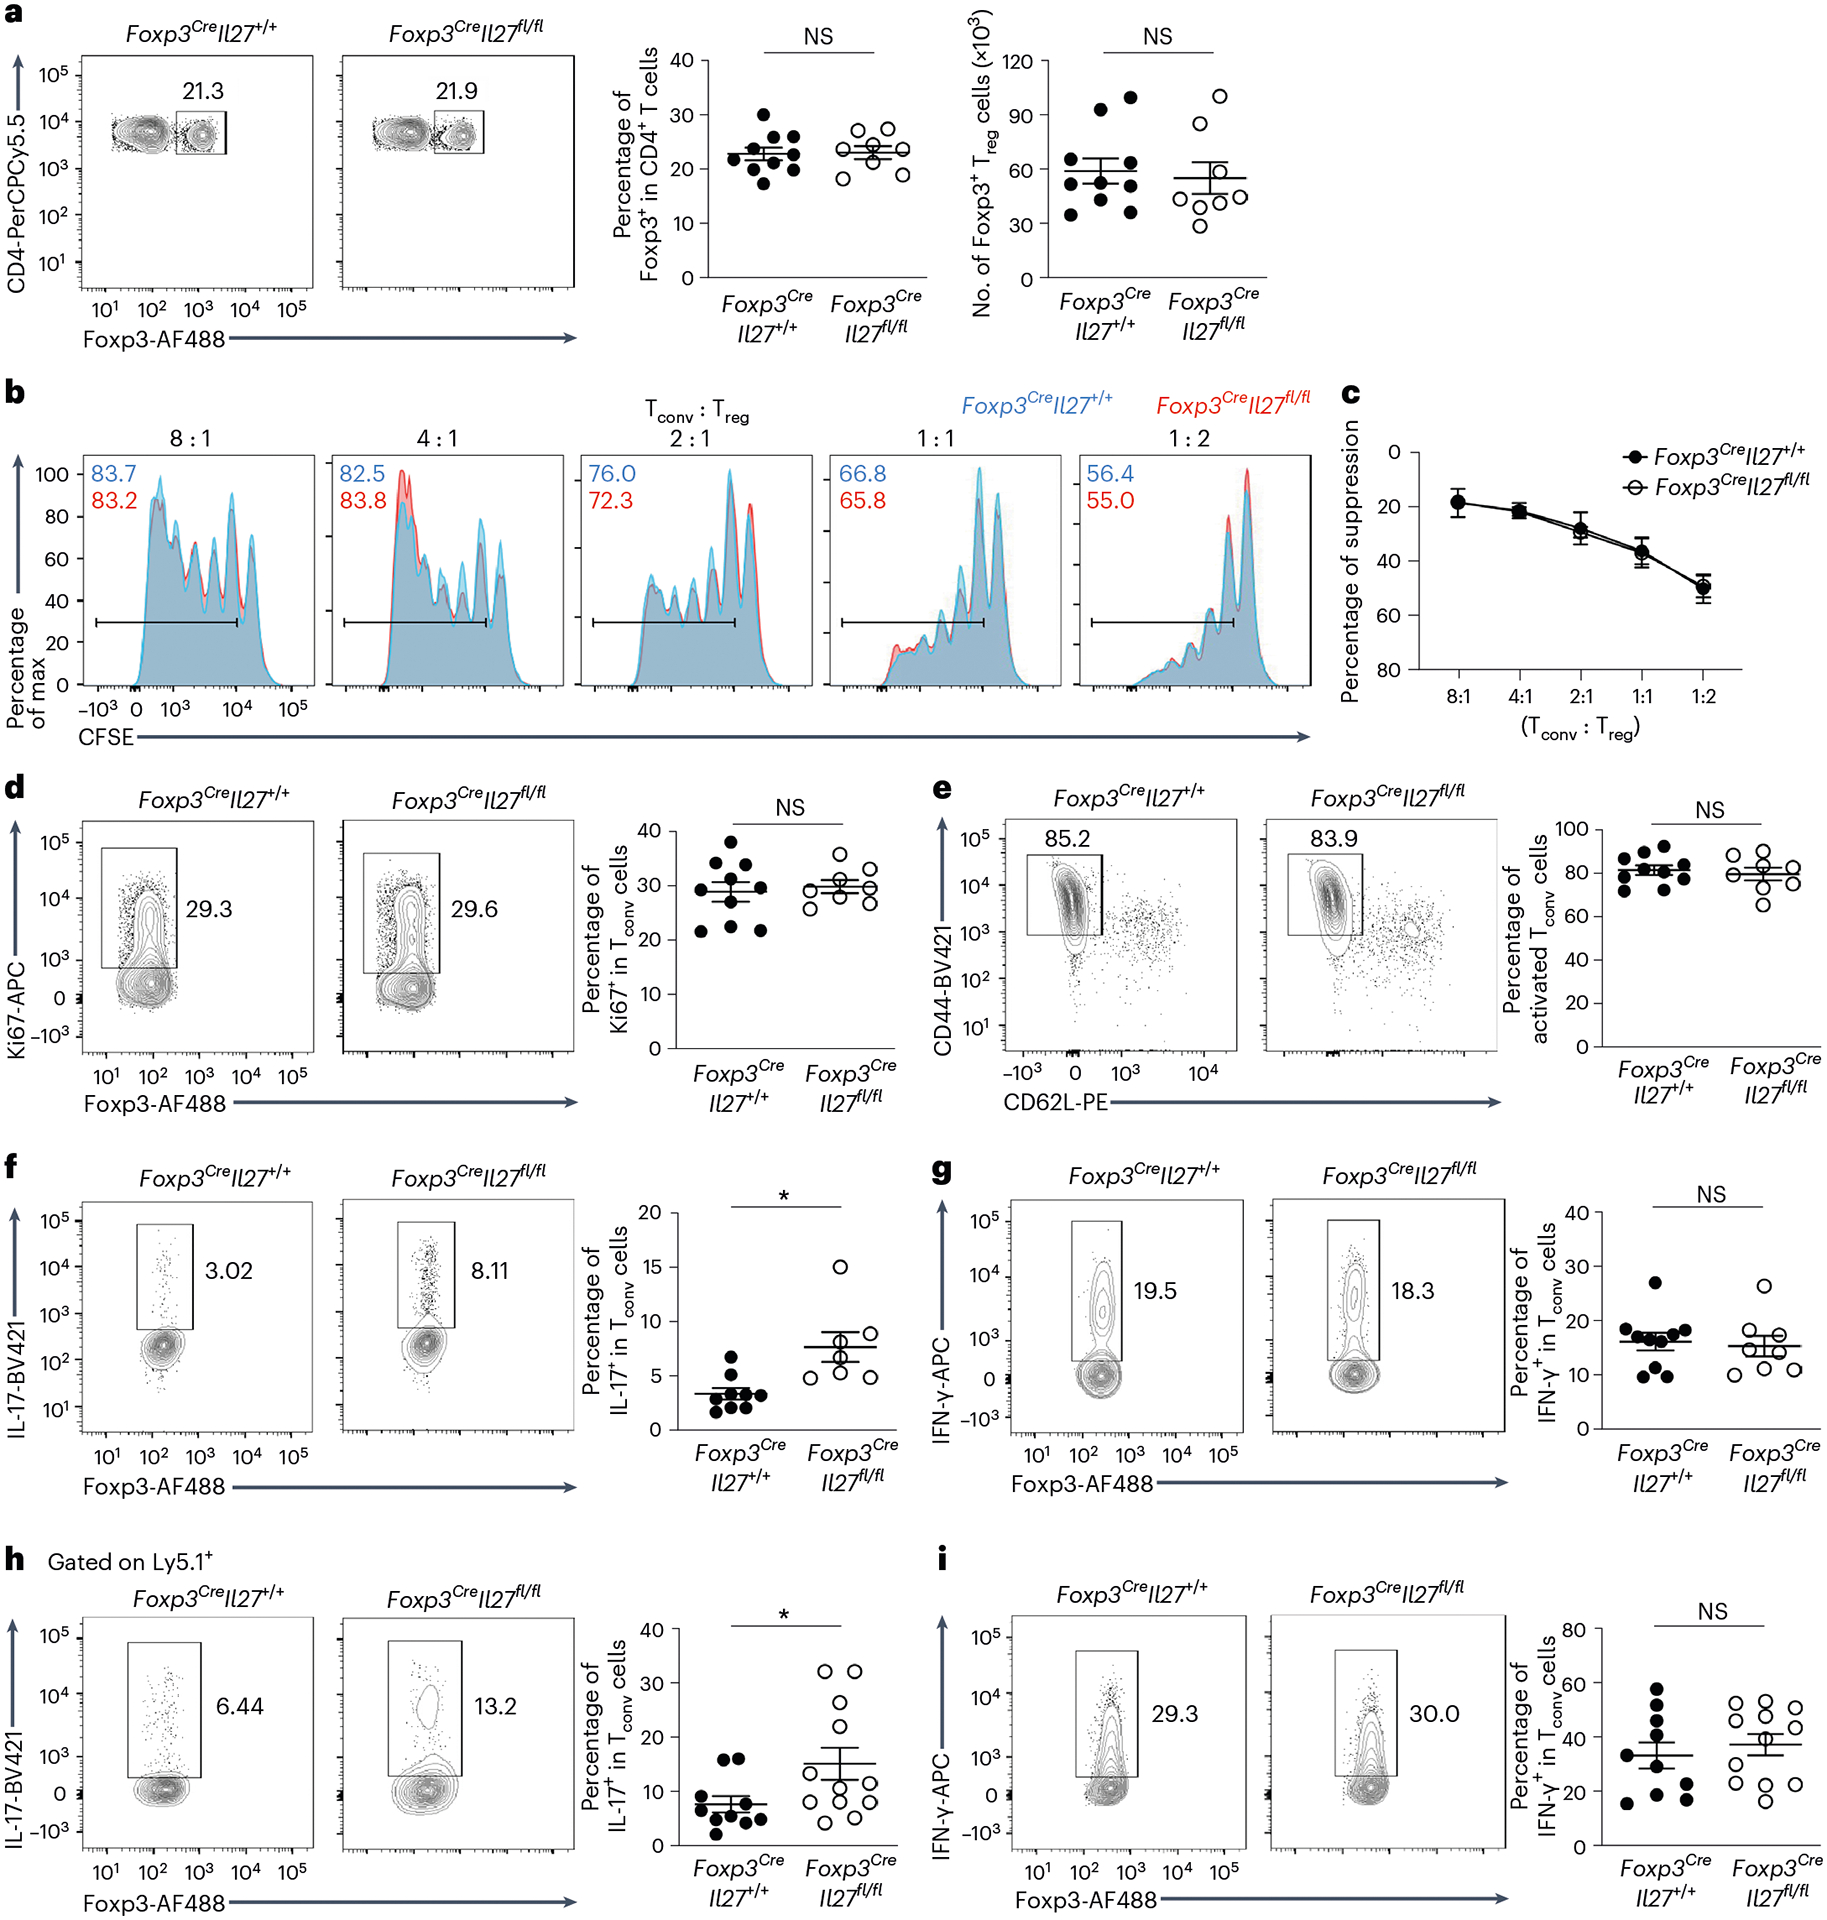
Fig. 3 |. A selective defect in regulating intestinal TH17 cell responses in mice harboring Treg cells incapable of producing IL-27.

a, FACS analysis, frequencies and numbers of Foxp3+ Treg cells gated on the live CD4+ population in SI LP of Foxp3CreIl27fl/fl mice and WT littermates (age ~8–12 weeks). Each symbol represents an individual mouse (n = 10 for Foxp3CreIl27+/+ and 8 for Foxp3CreIl27fll/fl). b,c, FACS analysis (b) and percentage of suppression of proliferation (c) of WT Tconv cells by SI LP Treg cells isolated from either WT or Foxp3CreIl27fl/fl mice in an in vitro suppression assay. Data represent three independent experiments (n = 2). d–g, FACS analysis and frequencies of Ki67+ (d), CD44hiCD62Llo (e), IL-17+ (f) and IFN-γ+ Tconv (g) cells gated on the live CD4+Foxp3− population in SI LP of Foxp3CreIl27fl/fl mice and WT littermates (age ~8–12 weeks). Each symbol represents an individual mouse (n = 10 for Foxp3CreIl27+/+ and 8 for Foxp3CreIl27fll/fl). h,i, FACS analysis and frequencies of IL-17+ (h) and IFN-γ+Ly5.1+ (i) Teff cells (isolated from Ly5.1+Foxp3KO mice) gated on the live CD4+ population in SI LP of RAG-deficient mice 3 weeks after being co-transferred with Treg cells isolated from either Foxp3CreIl27fl/fl mice or WT littermates. Each symbol represents an individual mouse (n = 10 for Foxp3CreIl27+/+ and 12 for Foxp3CreIl27fll/fl). Data are presented as mean values ± s.d. In a, NS (not significant) = 0.8805 (left) and 0.7346 (right). In d, NS = 0.6613. In e, NS = 0.6285. In f, *P = 0.0196. In g, NS = 0.7544. In h, *P = 0.0391. In I, NS = 0.5283. Statistical significance was determined using a two-tailed, unpaired Student’s t-test.
