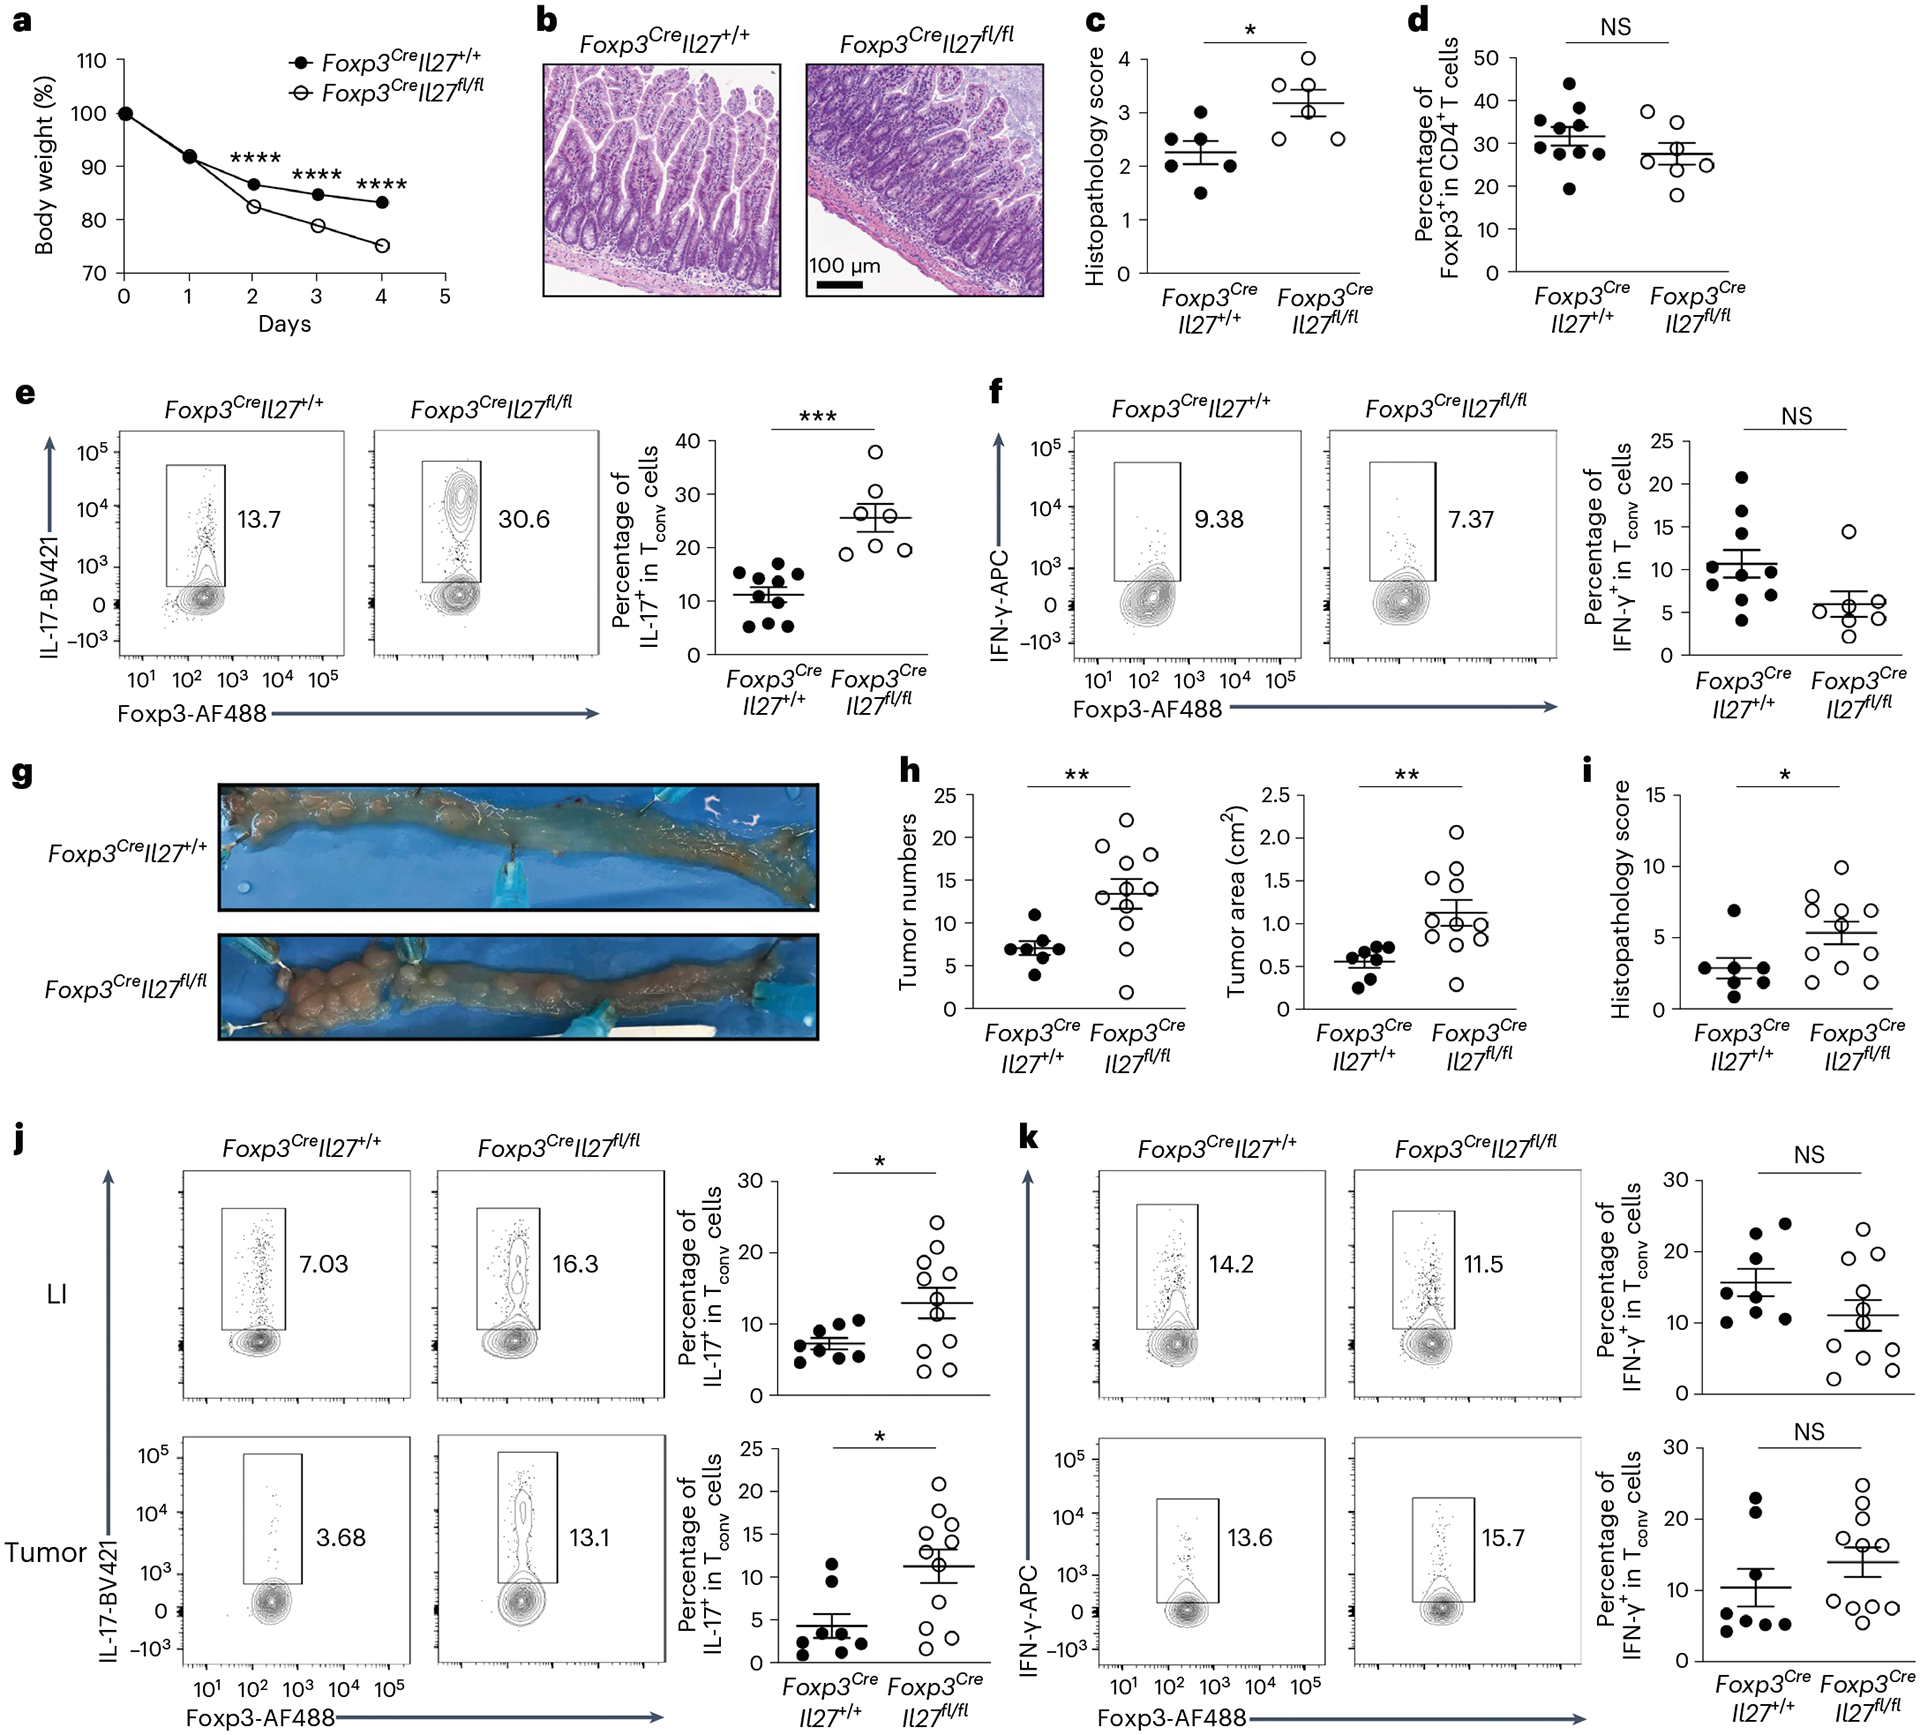
Fig. 4 |. Loss of Treg cell-derived IL-27 led to exacerbated intestinal inflammation and colitis-associated cancer.

a, Percentage of body weight change of Foxp3CreIl27fl/fl mice and WT littermates after aCD3 monoclonal antibody administration. Each symbol represents the average of mice from four independent experiments (n = 16 for Foxp3CreIl27+/+ and 18 for Foxp3CreIl27fll/fl). b, Four days after initial aCD3 monoclonal antibody injection, small intestine sections from the mice were stained with H&E for microscopic imaging. Scale bar, 100 μm. Data represent four independent experiments. c, Semiquantitative scoring of histopathology. Each symbol represents an individual mouse (n = 6). d–f, FACS analysis and frequencies of Foxp3+ Treg cells (d), IL-17+ Tconv cells (e) and IFN-γ+ Tconv cells (f) gated on the live CD4+Foxp3− population in SI LP of aCD3 monoclonal antibody-treated Foxp3CreIl27fl/fl mice and WT littermates. Each symbol represents an individual mouse (n = 10 for Foxp3CreIl27+/+ and 7 for Foxp3CreIl27fll/fl). g, Representative colonic photos from Foxp3CreIl27fl/fl mice and WT littermates 12 weeks after AOM/DSS treatment. Data represent three independent experiments. h, Numbers and area of colorectal tumors in Foxp3CreIl27fl/fl mice and WT littermates. i, Semiquantitative scoring of histopathology. Each symbol represents an individual mouse (n = 7 for Foxp3CreIl27+/+ and 11 for Foxp3CreIl27fll/fl). j,k, FACS analysis and frequencies of IL-17+ (j) and IFN-γ+ (k) Tconv cells gated on the live CD4+Foxp3− population in LI LP or colorectal tumors of Foxp3CreIl27fl/fl mice and WT littermates 12 weeks after AOM/DSS treatment. Each symbol represents an individual mouse (n = 8 for Foxp3CreIl27+/+ and 11 for Foxp3CreIl27fll/fl). Data are presented as mean values ± s.d. In a, ****P < 0.0001. In c, *P = 0.0187. In d, NS = 0.2424. In e, ***P = 0.0008. In f, NS = 0.05. In h, **P = 0.0051 (left) and 0.004 (right). In i, *P = 0.0363. In j, *P = 0.0278 (up) and 0.0101 (bottom). In k, NS = 0.1307 (up) and 0.3073 (bottom). Statistical significance was determined using a two-tailed, unpaired Student’s t-test.
