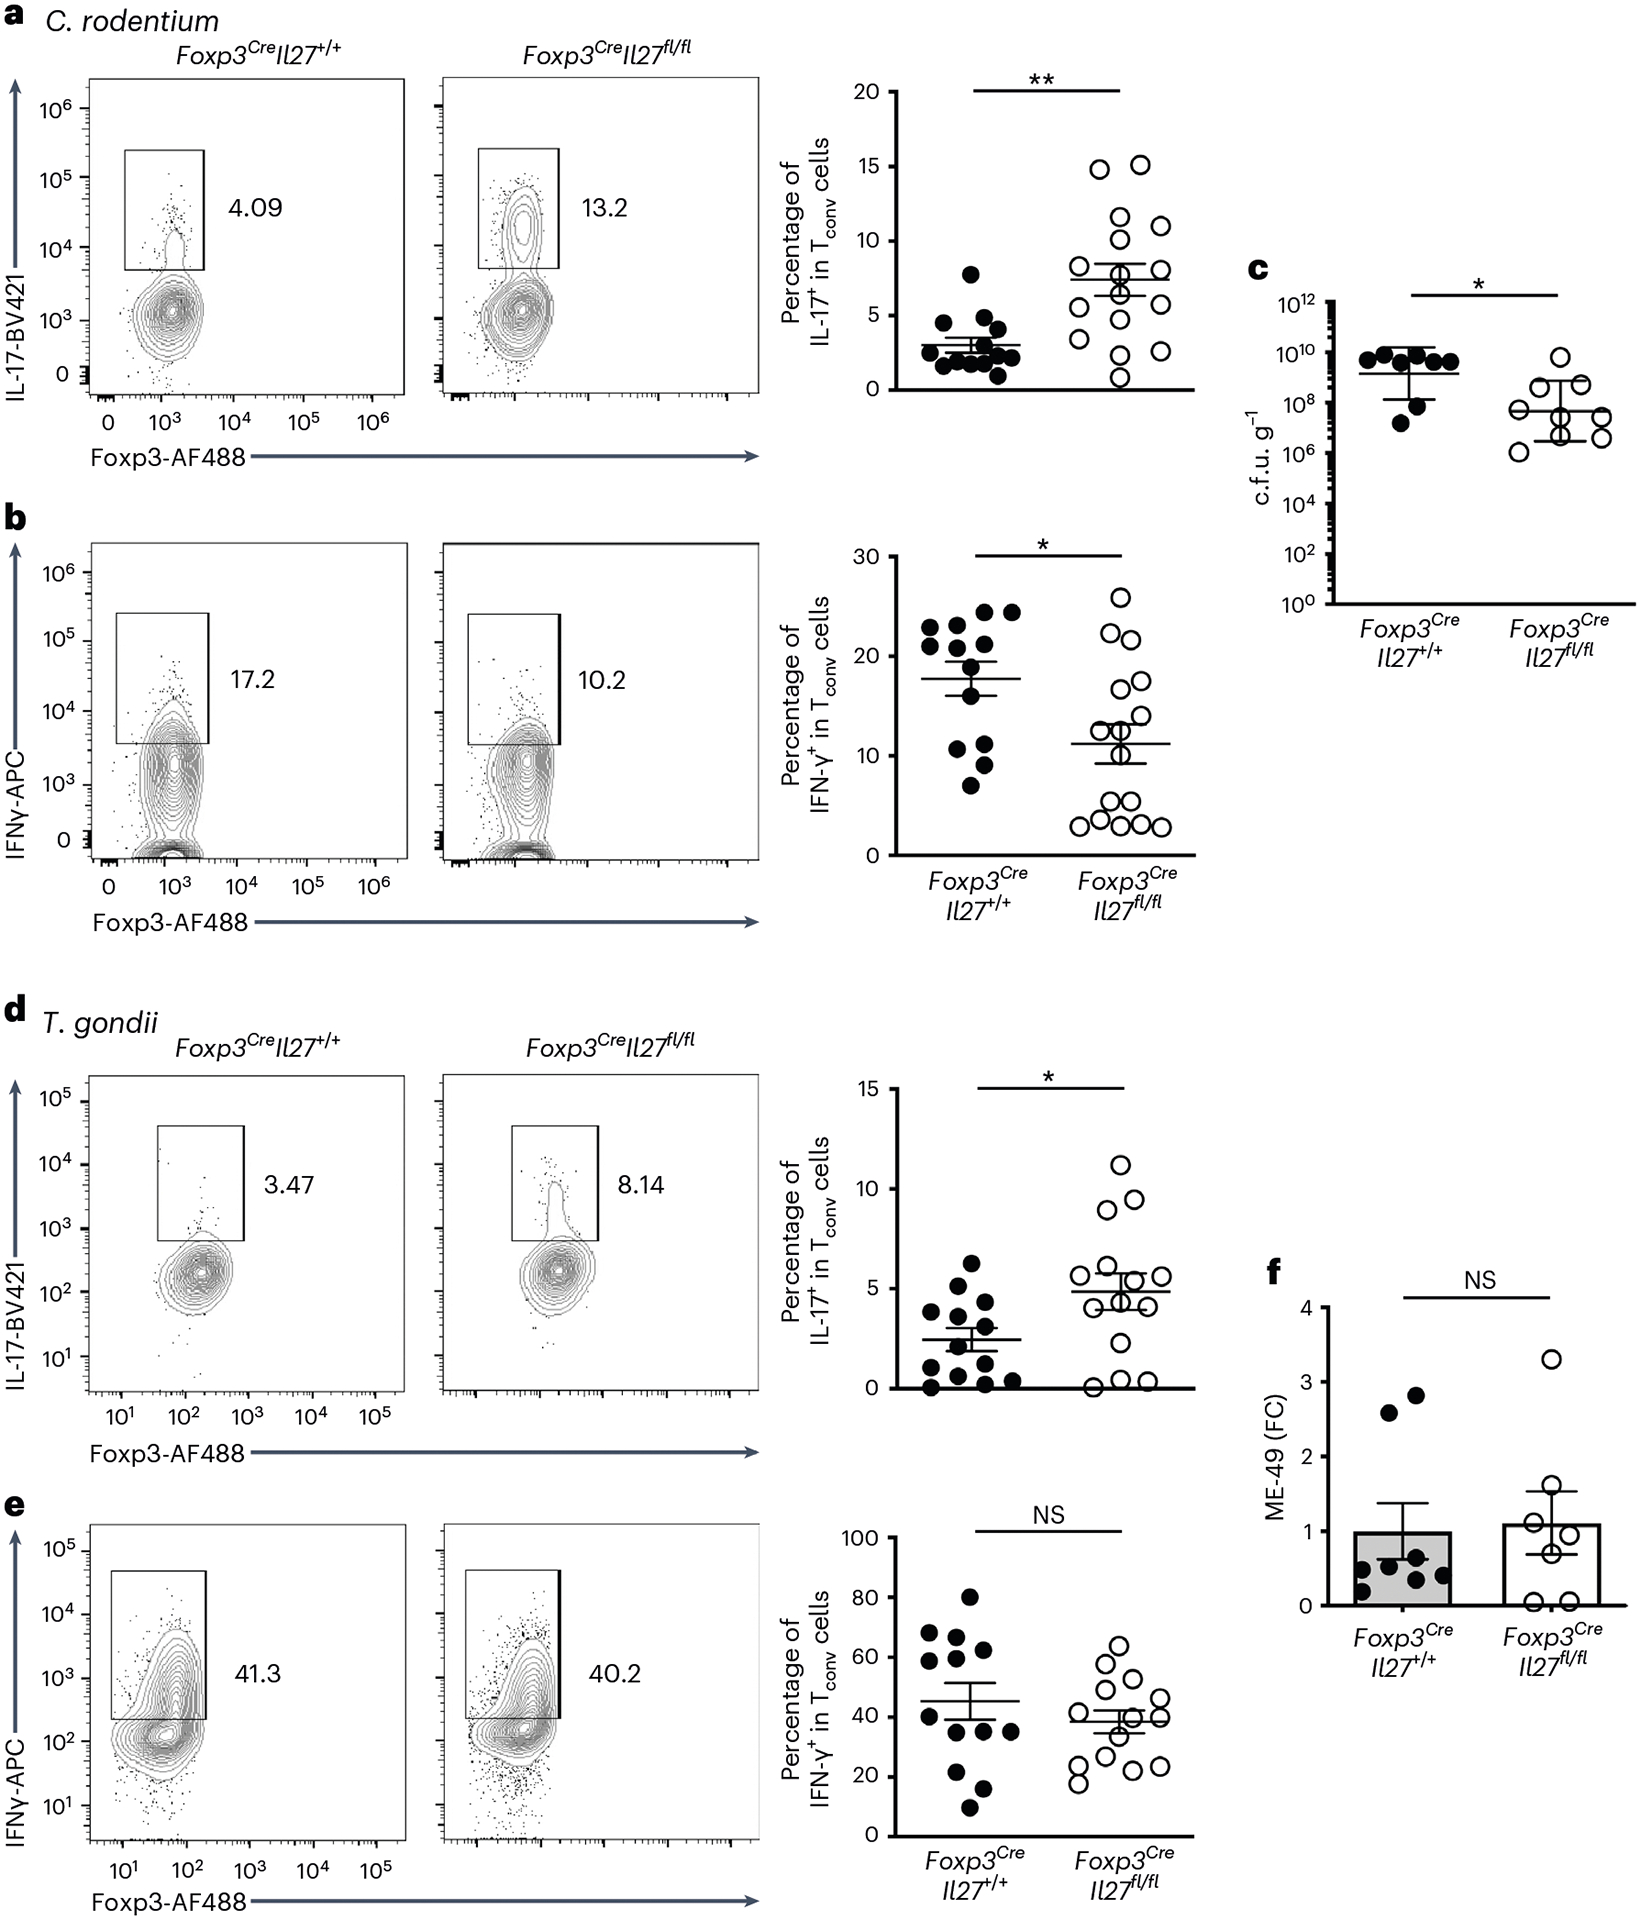
Fig. 6 |. Enhanced IL-17 responses in mice with Treg cell-specific IL-27 ablation selectively helped protect against enteric bacterial infection.

a,b, FACS analysis and frequencies of IL-17+ (a) and IFN-γ+ (b) Tconv cells gated on the live CD4+Foxp3− population in LI LP of Foxp3CreIl27fl/fl mice and WT littermates at day 10 post-C. rodentium infection. Each symbol represents an individual mouse (n = 13 for Foxp3CreIl27+/+ and 16 for Foxp3CreIl27fll/fl). c, Enumeration of C. rodentium in the LI of Foxp3CreIl27fl/fl mice and WT littermates at day 10 post-C. rodentium infection. Each symbol represents an individual mouse (n = 8 for Foxp3CreIl27+/+ and 9 for Foxp3CreIl27fll/fl). d,e, FACS analysis and frequencies of IL-17+ (d) and IFN-γ+ (e) Tconv cells gated on the live CD4+Foxp3− population in SI LP of Foxp3CreIl27fl/fl mice and WT littermates at day 8 post-T. gondii infection. Each symbol represents an individual mouse (n = 13 for Foxp3CreIl27+/+ and 14 for Foxp3CreIl27fll/fl). f, The qPCR analysis of parasite burden in SI of Foxp3CreIl27fl/fl mice and WT littermates at day 8 post-T. gondii infection. Each symbol represents an individual mouse (n = 8 for Foxp3CreIl27+/+ and 7 for Foxp3CreIl27fll/fl). Data are presented as mean values ± s.d. In a, **P = 0.0013. In b, *P = 0.0187. In c, *P = 0.0221. In d, *P = 0.0368. In e, NS = 0.3574. In f, NS = 0.8449. Statistical significance was determined using a two-tailed, unpaired Student’s t-test.
