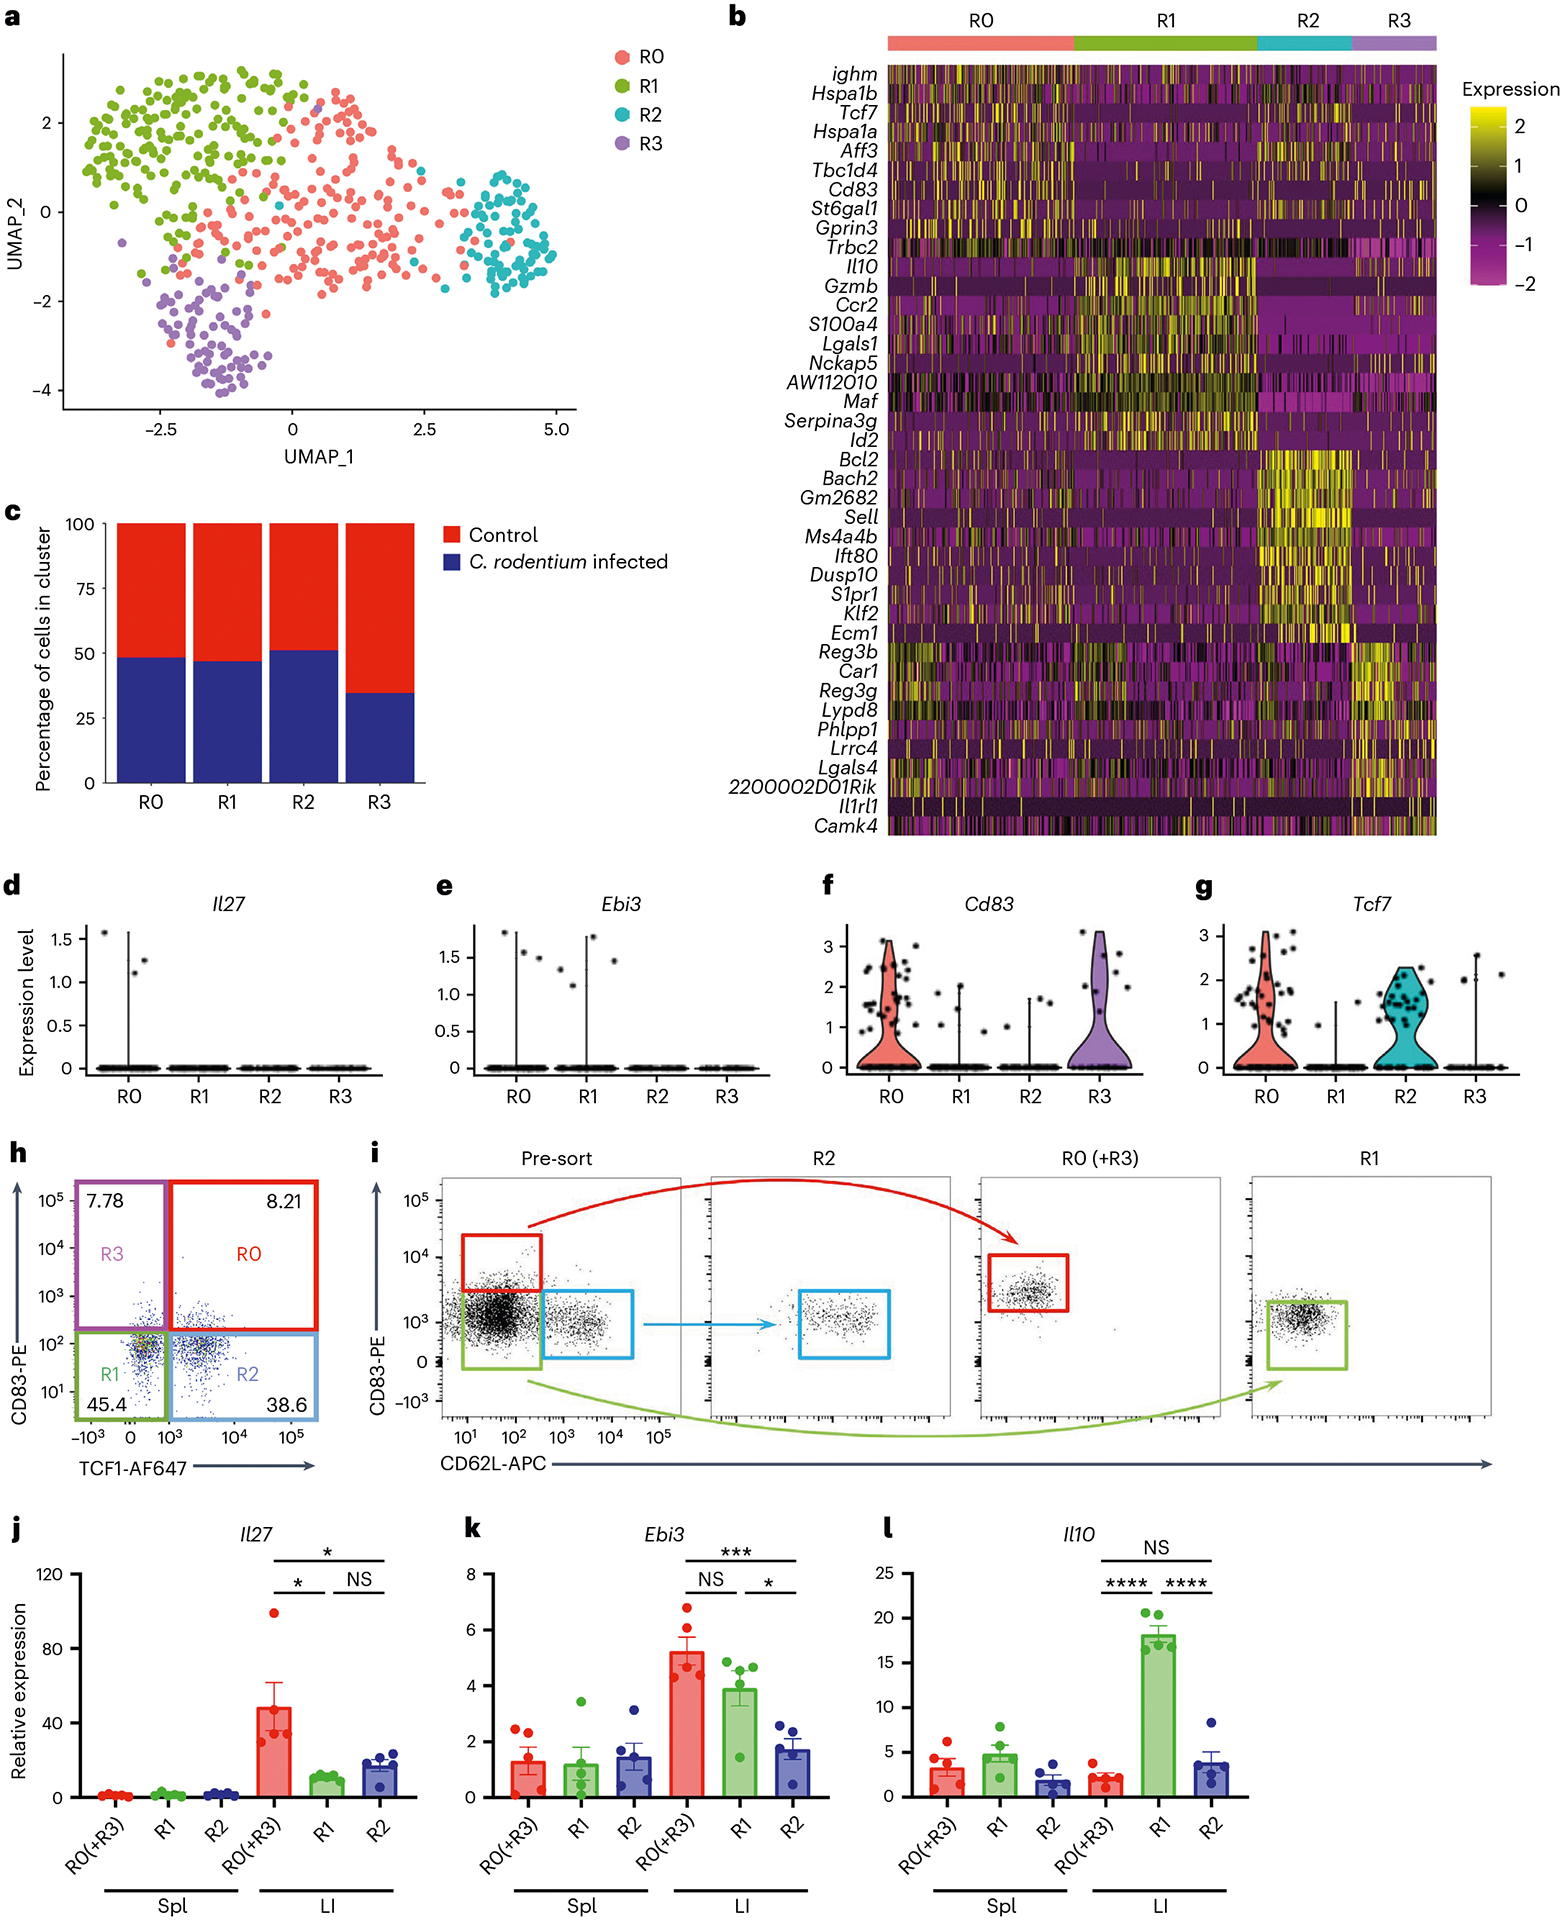
Fig. 7 |. Single-cell analyses identify a putative IL-27-producing Treg cell subset in the inflammatory intestinal tissue.

a, UMAP plots of intestinal Treg cell clusters, colored by cluster identity. b, Heatmap of the top ten DEGs between each intestinal Treg cell cluster. c, Percentage of cells within each intestinal Treg cell cluster from mice with or without C. rodentium infection. d–g, Violin plots of Il27 (d), Ebi3 (e), Cd83 (f) and Tcf7 (g) in different intestinal Treg cell clusters from C. rodentium-infected mice. h, FACS analysis of intestinal CD4+Foxp3+ Treg cell clusters based on the expression of CD83 and TCF1. i, Representative FACS profiles with gating strategy for isolating different intestinal Treg cell subsets based on the expression of CD83 and CD62L. j–l, The qPCR analyses for the expressions of Il27 (j), Ebi3 (k) and Il10 (l) in different Treg cell subsets in spleen (Spl) or LI LP from C. rodentium-infected mice. Each symbol represents a FACS-isolated cell sample pooled from three mice (n = 5). Data are presented as mean values ± s.d. In j, *P = 0.0441 (up) and 0.0186 (bottom left), and NS = 0.0806 (bottom right). In k, ***P = 0.0005 (up), NS = 0.1380 (bottom left) and *P = 0.0178 (bottom right). In l, NS = 0.2260 (up), and ****P < 0.0001 (bottom left) and < 0.0001 (bottom right). Statistical significance was determined using a two-tailed, unpaired Student’s t-test.
