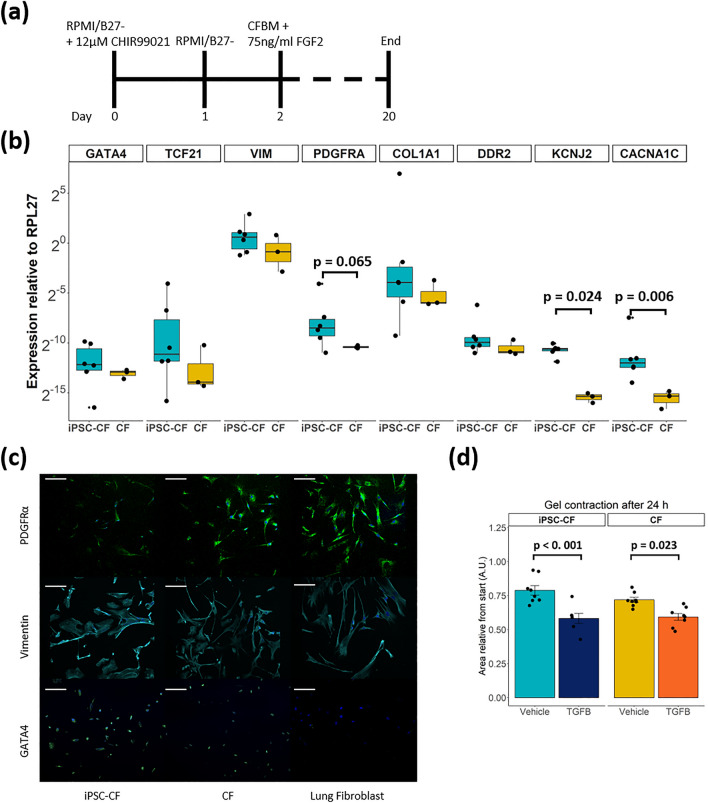
Figure 1.
(a) Overview differentiation protocol. CFBM indicates cardiac fibroblast basal medium and FGF2 fibroblast growth factor 2. (b) Gene panel of cardiac (GATA4, TCF21), fibroblast (VIM, PDGFRA, COL1A1, DDR2) and ion channel (KCNJ2, CACNA1C) genes (N = 6 differentiations, N = 3 replicates from 1 donor). A student’s t test is performed to test difference in gene expression between the two groups. In the case of KCNJ2 a Mann–Whitney U test was applied. (c) Immunostaining for PDGFRα, Vimentin and GATA4 in iPSC-CF, CF and lung fibroblast. Counterstained with Hoechst in blue. Scale bar indicates 100 μm. (d) Gel contraction assay, gels stimulated with vehicle or TGF-β for 24 h. Data is presented as area relative from 0 h (N = 8 gels per group). A linear regression model was performed to test for difference between stimulation and cell type, with a Tukey’s post hoc analysis. See also Fig. S1. Graphs represent mean ± SEM.

