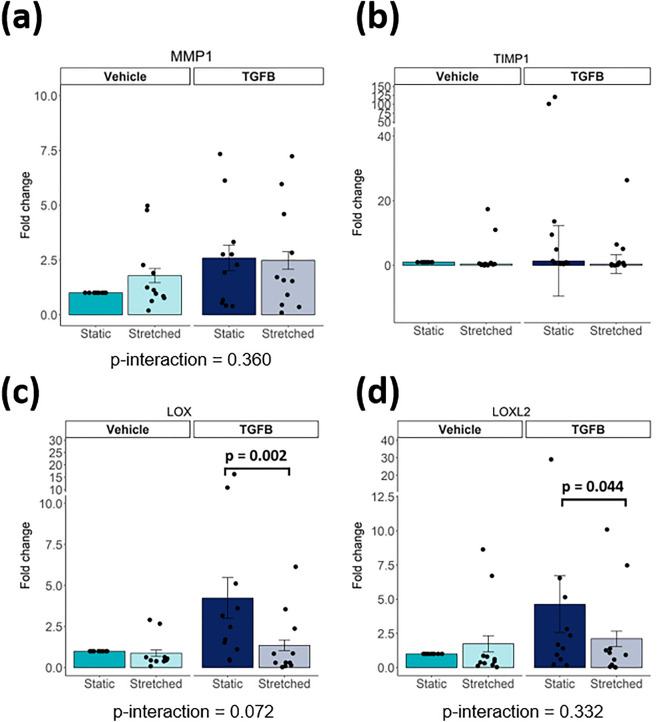
Figure 3.
Gene expression of MMP1, TIMP1, LOX, LOXL2 after stimulation of iPSC-CF with TGF-β and cyclic stretch (N = 11 from 6 independent differentiation batches. For MMP1, LOX and LOXL2 A linear mixed model, with the experimental conditions considered as fixed parameters and the batches of differentiation as random parameters was applied. Tukey post-hoc tests were performed to correct for multiple comparisons. Graphs represent mean ± SEM. For TIMP1 a Kruskal–Wallis test was performed. Graph represent median ± IQR.

