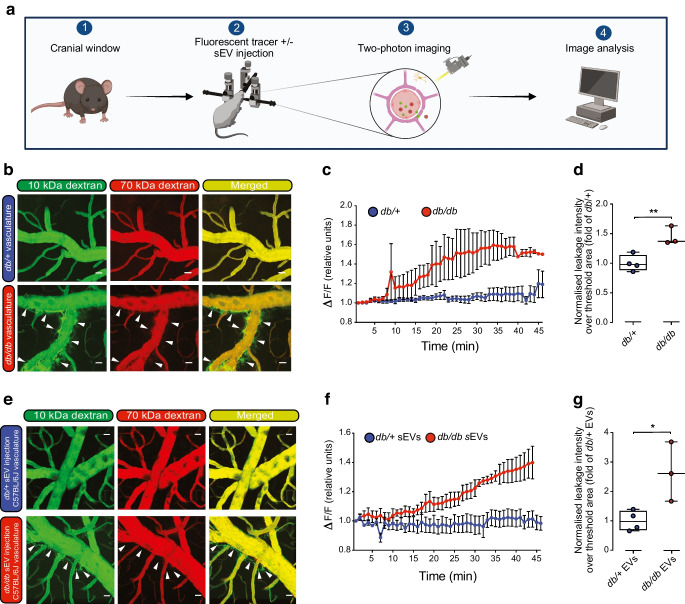
Fig. 4.
sEVs from diabetic mice induce cerebrovascular permeability in vivo. (a) Schematic detailing the two-photon intravital microscopy protocol utilised to examine cerebrovascular permeability (created with BioRender.com). (b) Representative still images from in vivo multiphoton intravital microscopy videos following retro-orbital injection of 70 kDa Texas Red–dextran and 10 kDa FITC–dextran into 14-week-old db/+ or db/db mice (BKS background) 45 min after injection. Arrowheads indicate regions of leakage of the 10 kDa tracer. Scale bar, 25 μm. db/+, n=4 biological replicates; db/db, n=3 biological replicates. (c) Assessment of 10 kDa FITC–dextran and 70 kDa Texas Red–dextran leakage over a 45 min period in db/+ and db/db mice with the change in fluorescence quantified over the observed region of interest (ΔF/F). Time zero was set to 1 for each group. (d) Total normalised leakage intensity over a 45 min time period quantified over total threshold area in db/+ and db/db mice. Data are plotted as fold of db/+. **p<0.01 by unpaired t test. (e) Representative still images from in vivo multiphoton intravital microscopy videos following retro-orbital injection of 70 kDa Texas Red–dextran and 10 kDa FITC–dextran into wild-type C57Bl/6J mice that were injected retro-orbitally with db/+ or db/db sEVs isolated from an equal volume of plasma (after 45 min). Scale bar, 25 μm. db/+ sEVs, n=4 biological replicates; db/db sEVs, n=3 biological replicates. (f) Assessment of 10 kDa FITC–dextran and 70 kDa Texas Red–dextran leakage over a 45 min period immediately after sEV injection with the change in fluorescence quantified over the observed region of interest (ΔF/F). Time zero was set to 1 for each group. (g) Total normalised leakage intensity over a 45 min period quantified over the total threshold area in mice treated with db/+ and db/db EVs. Data are presented as fold of db/+ EVs. *p<0.05 by unpaired t test. (d, g) Boxes depict the median with upper and lower quartiles and the whiskers depict the minimum and maximum

