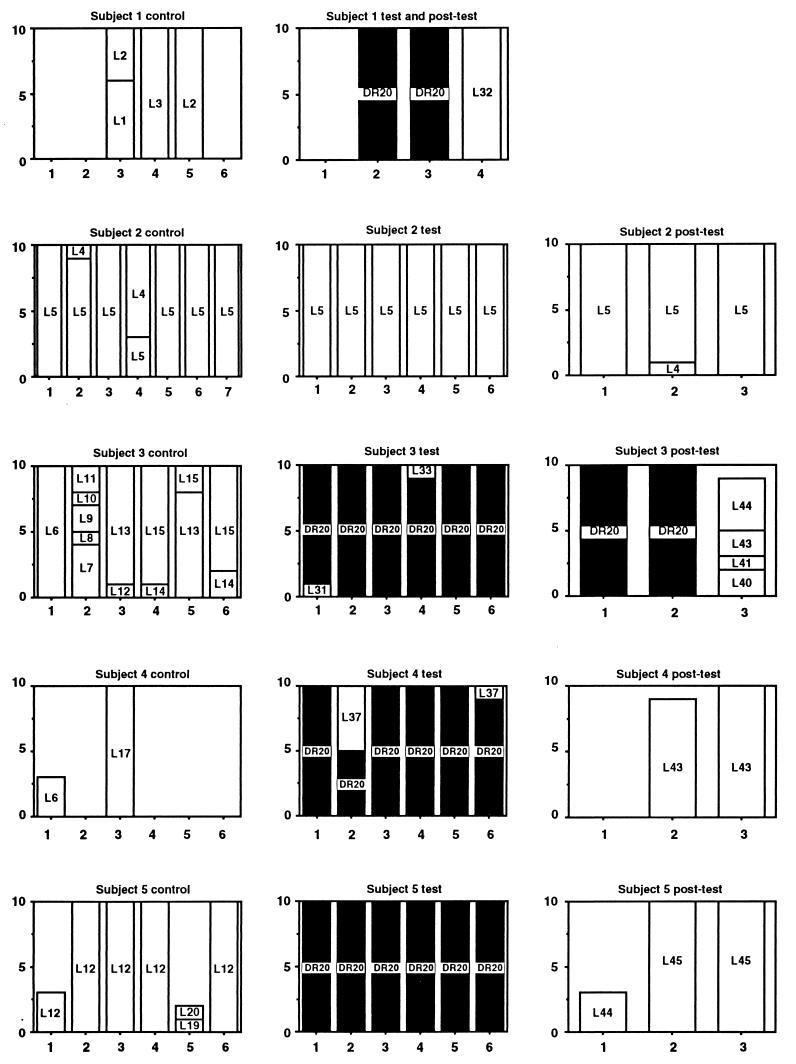
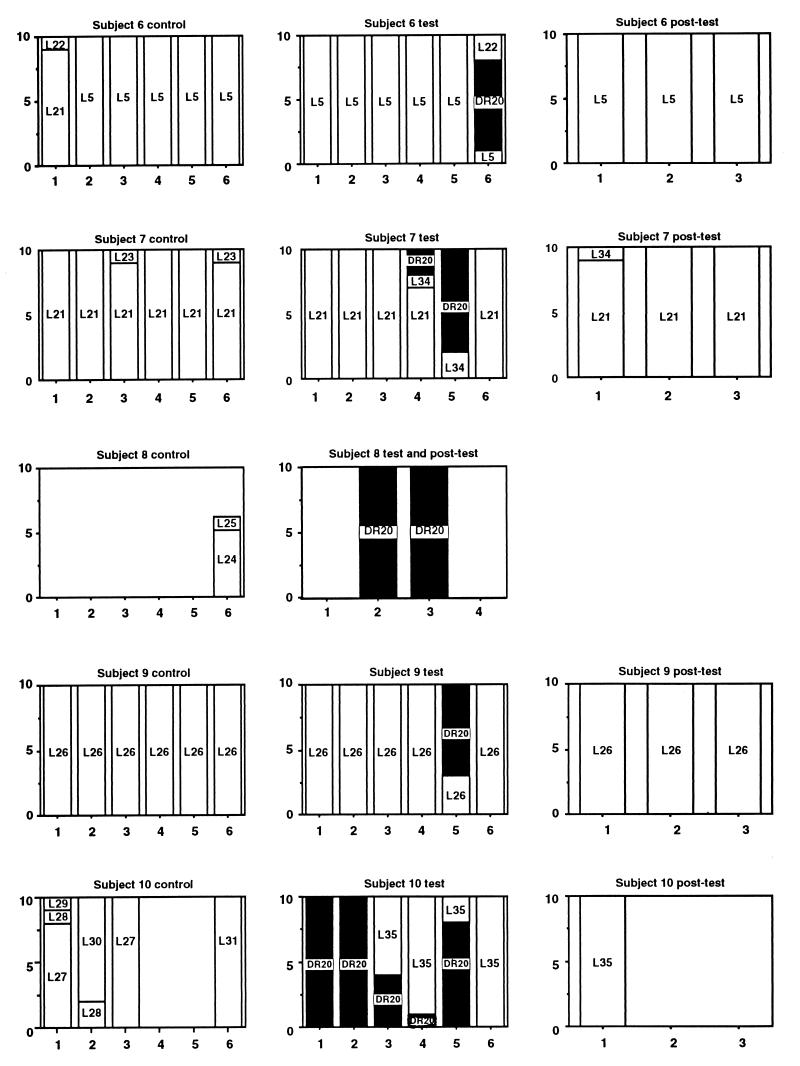
FIG. 2.
Graphic representation of the strain compositions of Lactobacillus populations harbored by 10 human subjects during the control, test, and posttest periods of the study. For each graph, the x axis indicates the number of isolates, and the y axis indicates the sample number. The strains are identified by numbers, and DR20 is indicated by solid columns.


