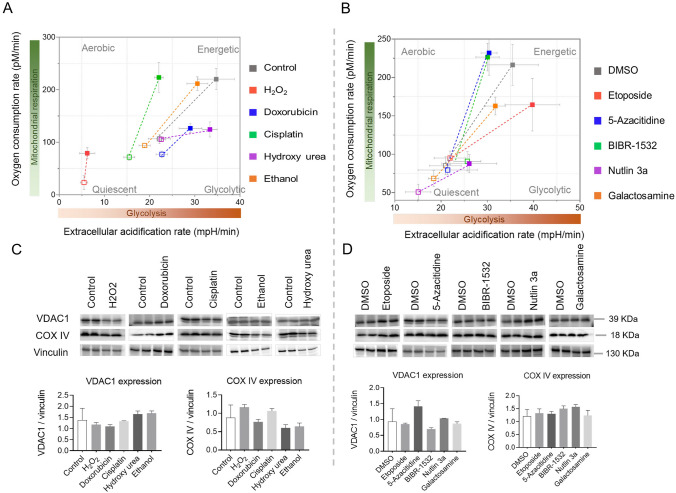
Fig. 4.
Senescence alters cellular bioenergetics without affecting the mitochondrial mass in primary mouse hepatocytes. A, B Oxidative phosphorylation and glycolytic capacities measured by Seahorse flux analyzer. Basal and stressed levels were measured with 10 mM glucose, 2 mM pyruvate, and 1 mM glutamine as substrates. Error is shown as standard deviation. C, D Representative Immunoblotting images of the proteins for assessing mitochondrial mass (VDAC1 and COX IV) after 24 h of treatment. Vinculin served as a loading control. The band intensity was quantified using Image J. The final concentration of 200 μM H2O2, 1 μM doxorubicin, 5 μg/ml cisplatin, 100 μM hydroxy urea, 100 mM ethanol, 10 μM etoposide, 5 μM 5-azacitidine, 20 μM BIBR-1532, 10 μM nutlin 3a, and 1 mM galactosamine were used. Error is shown as standard deviation (n = 3)

