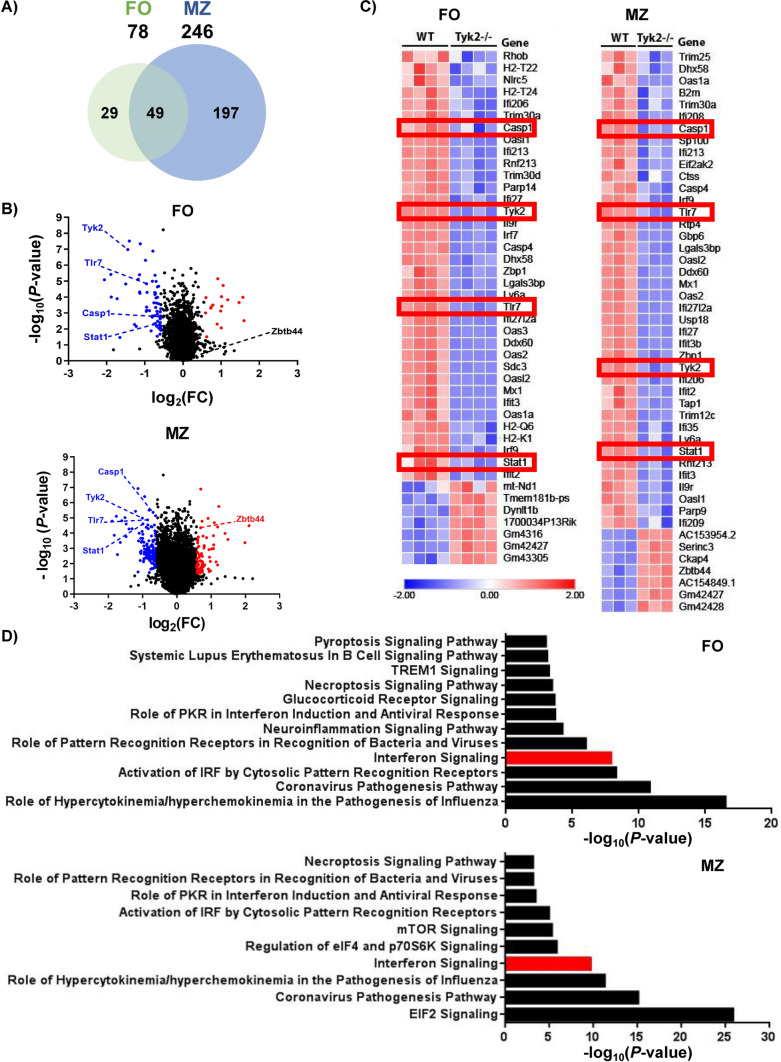
Fig. 3.
RNA-Seq analysis of gene expression in FO and MZ B cells in homeostasis. FACS-purified FO and MZ cells from WT and Tyk2−/− mice were used to prepare total RNA (MZ cells) or mRNA (FO cells) as indicated in the Material and Methods section. A Venn diagram showing the number of differentially expressed genes (DEGs) between WT and Tyk2−/− mice in each cell subpopulation and those shared by both populations. A gene signature of 49 genes characteristic of Tyk2 deficiency is observed in both FO and MZ cells. B Distribution of DEGs according to FO or MZ cell population plotted as a function of their variation and significance (P-value < 0.05). Labeled in red and blue are representative up- and down-regulated genes, respectively. C Heatmap of DEGs of the IFN-I signaling pathway in FO and MZ cells. Higher expression levels are indicated in red and lower expression levels in blue. The red boxes highlight genes of interest whose expression was validated. D Histograms depicting the main canonical pathways obtained with the Ingenuity Pathway Analysis (IPA) in FO and MZ cells. IFN-I signaling pathway was identified as significantly deregulated (labeled in red). P-value < 0.05 for FO and a false discovery rate (FDR) < 0.05 for MZ B cells

