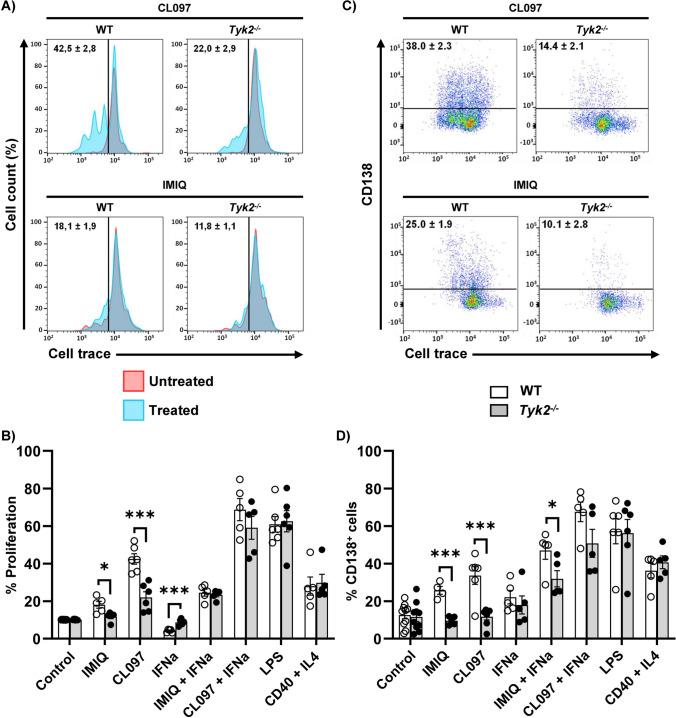
Fig. 5.
Proliferation and differentiation of splenic B cell cultures. B cells were obtained after depletion of T and plastic-adherent myeloid cells as described in Materials and Methods. The cells were loaded with Cell Trace (CellTracker™) following the manufacturer’s instructions and cultured with CL097 or Imiquimod/R837 (IMIQ, 2 μg/ml) in the absence or presence of IFNα (20 ng/ml), or with LPS (25 μg/ml) or anti-CD40 (10 μg/ml) and IL-4 (150 ng/ml) during 72 h. Cells were then recovered and dye dilution was determined by cytometry after staining with anti-CD138 to assess differentiation. A Representative overlaid histograms for CL097 and IMIQ treated cultures (histograms in blue) over untreated cultures (red histogram), displaying the cell trace signal. Proliferation was determined as the percentage of cells with dye diluted by cell division (mean ± SEM; n = 5–6). B Quantitation of cell proliferation induced by treatment of cultures with different stimuli for 72 h. C Representative dot-plots showing CD138 and cell trace staining on treated cells (untreated cells are not shown). Numbers inside are the percentage of CD138+ cells referred to the isotype control (black lines) (mean ± SEM; n = 5–6). D Quantitation of CD138+ cells after 72 h of culture with different stimuli. Data in B and D are presented as individual values (dots), and the bars show the mean ± SEM (n = 4–10). Statistical analysis was performed by Student's t-test: * P < 0.05; ** P < 0.01; *** P < 0.001

