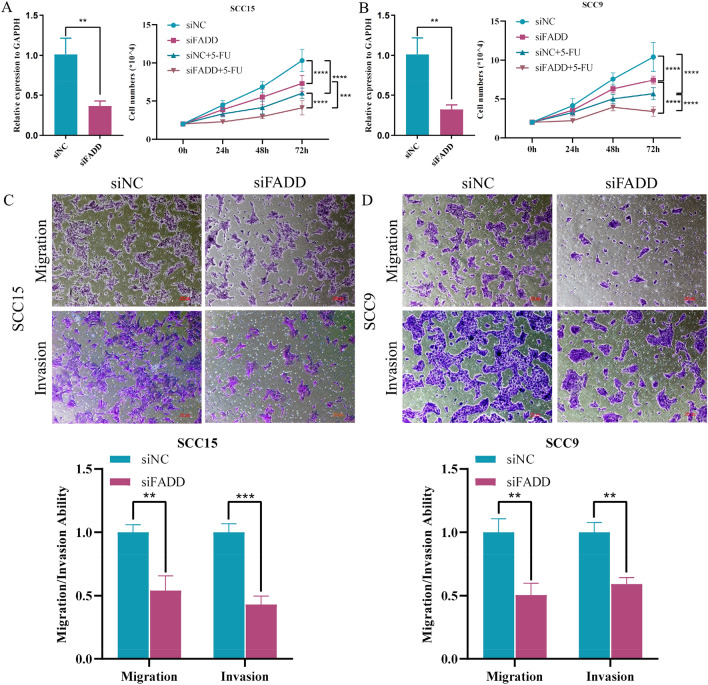
Figure 6.
Knockdown of FADD inhibited the progression and enhanced susceptibility to 5-FU of HNSCC cell. (A,B) Line diagram displaying the role of FADD knockdown in HNSCC cells proliferation and susceptibility to 5-FU. Student’s T test (SCC15 p = 0.0059; SCC9 p = 0.0048) and Two-way ANOVA (SCC15 siNC vs. siFADD p < 0.0001, siNC vs. siNC + 5-FU p < 0.0001, siFADD vs. siFADD + 5-FU p < 0.0001, siNC + 5-FU vs. siFADD + 5-FU p = 0.001; SCC9 siNC vs. siFADD p < 0.0001, siNC vs. siNC + 5-FU p < 0.0001, siFADD vs. siFADD + 5-FU p < 0.0001, siNC + 5-FU vs. siFADD + 5-FU p < 0.0001) were used to statistically test the efficiency of FADD knockdown and cell proliferation assays, respectively. (C,D) Transwell assay showing the contribution of FADD in HNSCC cell migration and invasion ability after downregulation of FADD. (SCC15 Migration p = 0.0037, Invasion p = 0.0005; SCC9 Migration p = 0.0015, Invasion p = 0.0037). Student’s T test was used to conduct statistical tests for migration and invasion ability.

