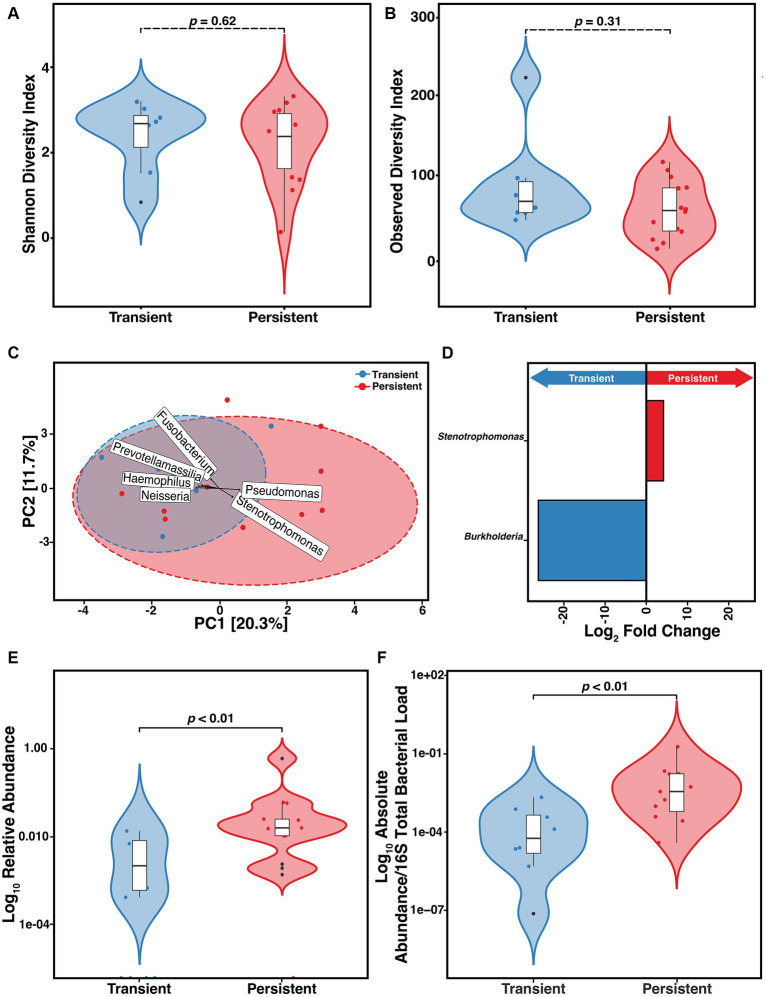
Figure 4.
Risk of developing persistent (n = 14) versus transient (n = 8) S. maltophilia infection in CF. (A) Shannon Diversity Index (SDI) (Wilcoxon, p = 0.62) (B) Observed Diversity Index (ODI) (Wilcoxon, p = 0.31). (C) Principal Component Analysis (PCA) with center-log ratio (CLR) transformation; (PERMANOVA, p = 0.03) and with top 6 taxa, present in ≥10% of samples, influencing unconstrained PCA clustering. (D) Taxa with significant log fold changes in relative abundance between transient and persistent infections, detected by DESeq2. (E) Relative abundance of S. maltophilia for transient and persistent at-infection case samples presented in the Log10 scale (Wilcoxon, p = 0.0044). (F) Absolute abundance/total 16S bacterial load for transient (n = 8) and persistent (n = 11) at-infection case samples presented in the Log10 scale (Wilcoxon, p = 0.005). Data points are represented on violin plots as colored dots. Outlier data points are black and are defined as any point that were beyond 1.5 times the interquartile range.

