Figure 2.
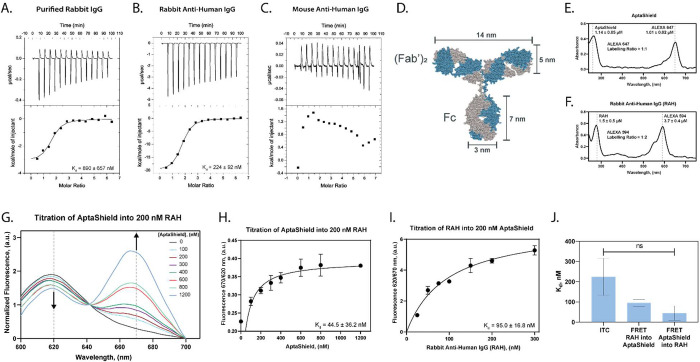
AptaShield DNA aptamer–IgG binding. Isothermal titration calorimetry (ITC) thermograms related to the titration between the AptaShield DNA aptamer and (a) purified IgGs from rabbit serum, (b) monoclonal rabbit antihuman IgG, and (c) monoclonal mouse antihuman IgG. Monitoring AptaShield DNA aptamer–rabbit IgG binding by FRET. (d) Depiction of the 3D structure of an IgG with corresponding dimensions. UV–vis spectra of (e) the ALEXA-647-labeled AptaShield DNA aptamer and (f) ALEXA-594-labeled rabbit antihuman IgG (RAH). The molar ratio of AptaShield DNA aptamer/RAH to fluorophore was determined using the relevant extinction coefficients (tabulated in Tables S1 and S2). The AptaShield DNA aptamer was found to be labeled at a 1:1 ratio, while the RAH was found to be labeled at a 2.3 (fluorophore):1 (RAH) ratio. (g) Fluorescence emission (Ex 550 nm) spectra of the titration of different concentrations of AptaShield DNA aptamer into 200 nM RAH. Binding curves related to the titration of (h) AptaShield DNA aptamer into 200 nM RAH and (i) RAH into 200 nM AptaShield DNA aptamer. (j) Statistical analysis of the AptaShield DNA aptamer–RAH dissociation constants (Kd) determined from ITC and FRET.

