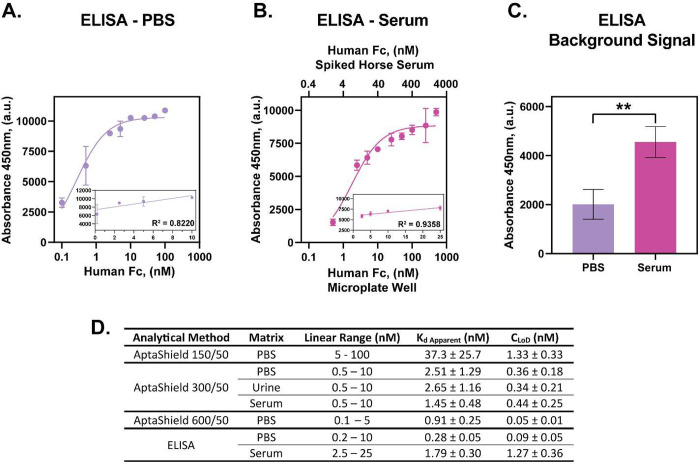
Figure 4.
Comparison of the analytical performance of the AptaShield biosensor with ELISA. Comparative direct sandwich ELISA concentration response curve for the detection of human Fc in (a) PBS and (b) horse serum. Inset are the linear regions of the curves. (c) ELISA background signal of analyte free PBS and horse serum, which were subtracted from the values to produce the concentration response curves. (d) Multiparametric analysis of the AptaShield biosensor and ELISA performance for analyte detection in PBS, blood serum, and urine. The values are presented as mean ± SEM from 3 to 5 replicas per condition. Statistical analysis was performed using two-tailed t test, and the symbol ** corresponds to p < 0.01.

