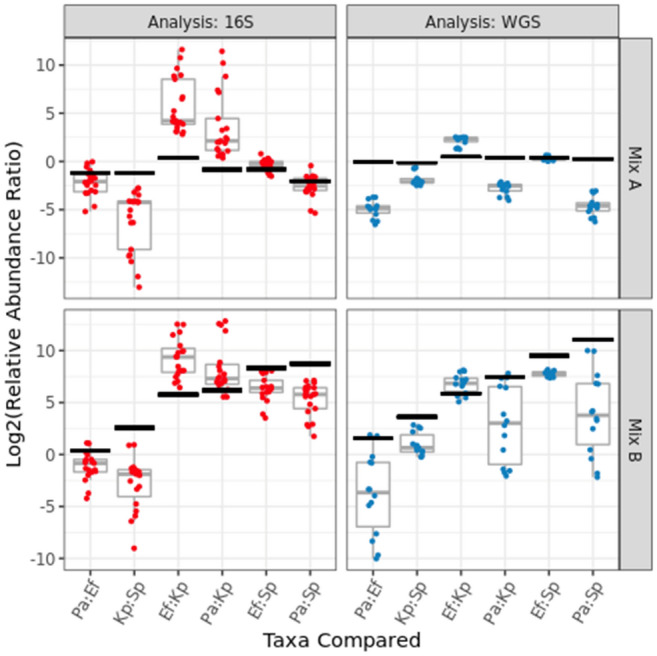
Figure 8.

For the DNA mixtures, independently measured ‘ground truth’ results (black 99% confidence intervals) for the ratios between taxa relative abundances can be compared to each individual lab’s amplicon (red points) or shotgun (blue points) metagenomic sequencing results, as well as the range of results (grey boxplots) among participating labs. The taxa in Mix A were roughly equally abundant, while the Mix B sample exhibited groups of taxa added at tenfold dilutions. The horizontal axis identifies the taxa (known to be present in the DNA mixtures) whose observed relative abundances were ratioed. The ground truth values were scaled to account for known 16S copy numbers (for amplicon sequencing) or genome sizes (for shotgun sequencing), so the ‘actual’ ratios vary slightly between the two analyses even though the DNA concentrations are identical. Genus-level taxonomic bar charts by (16S and WGS analysis) show the average composition observed for each DNA mixture (Fig. SI-10).
