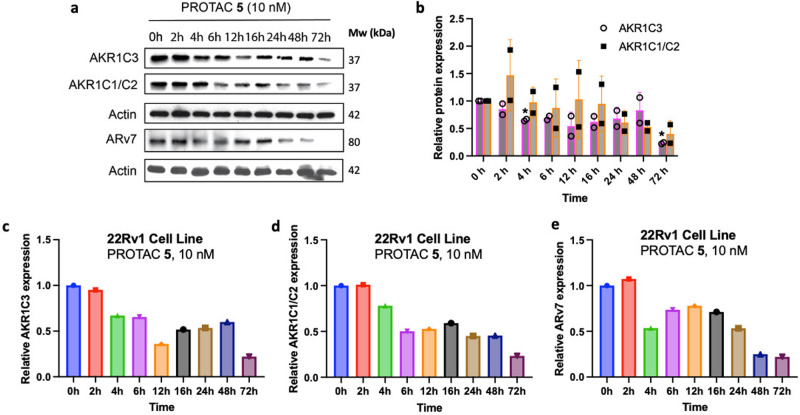
Fig. 7. Degradation of AKR1C3, AKR1C1/C2 and ARv7 by PROTAC 5.
a Time study of degradation of AKR1C3, AKR1C1/C2, and ARv7 upon treatment of 5 (10 nM) at different time points (0, 2, 4, 6, 12, 16, 24, 48, and 72 h). Blots are representative of two separate experiments; (b) combined quantification of a and replicates for AKR1C3 and AKR1C1/C2 expression. Data obtained from two technical replicates performed in duplicate is represented as the mean ± standard deviation. *p < 0.05 by two-tailed, unpaired Mann–Whitney test; (c) Quantification of a for AKR1C3 expression; (d) quantification of a for AKR1C1/C2 expression; (e) quantification of a for ARv7 expression. Relative expression is normalized to actin.

