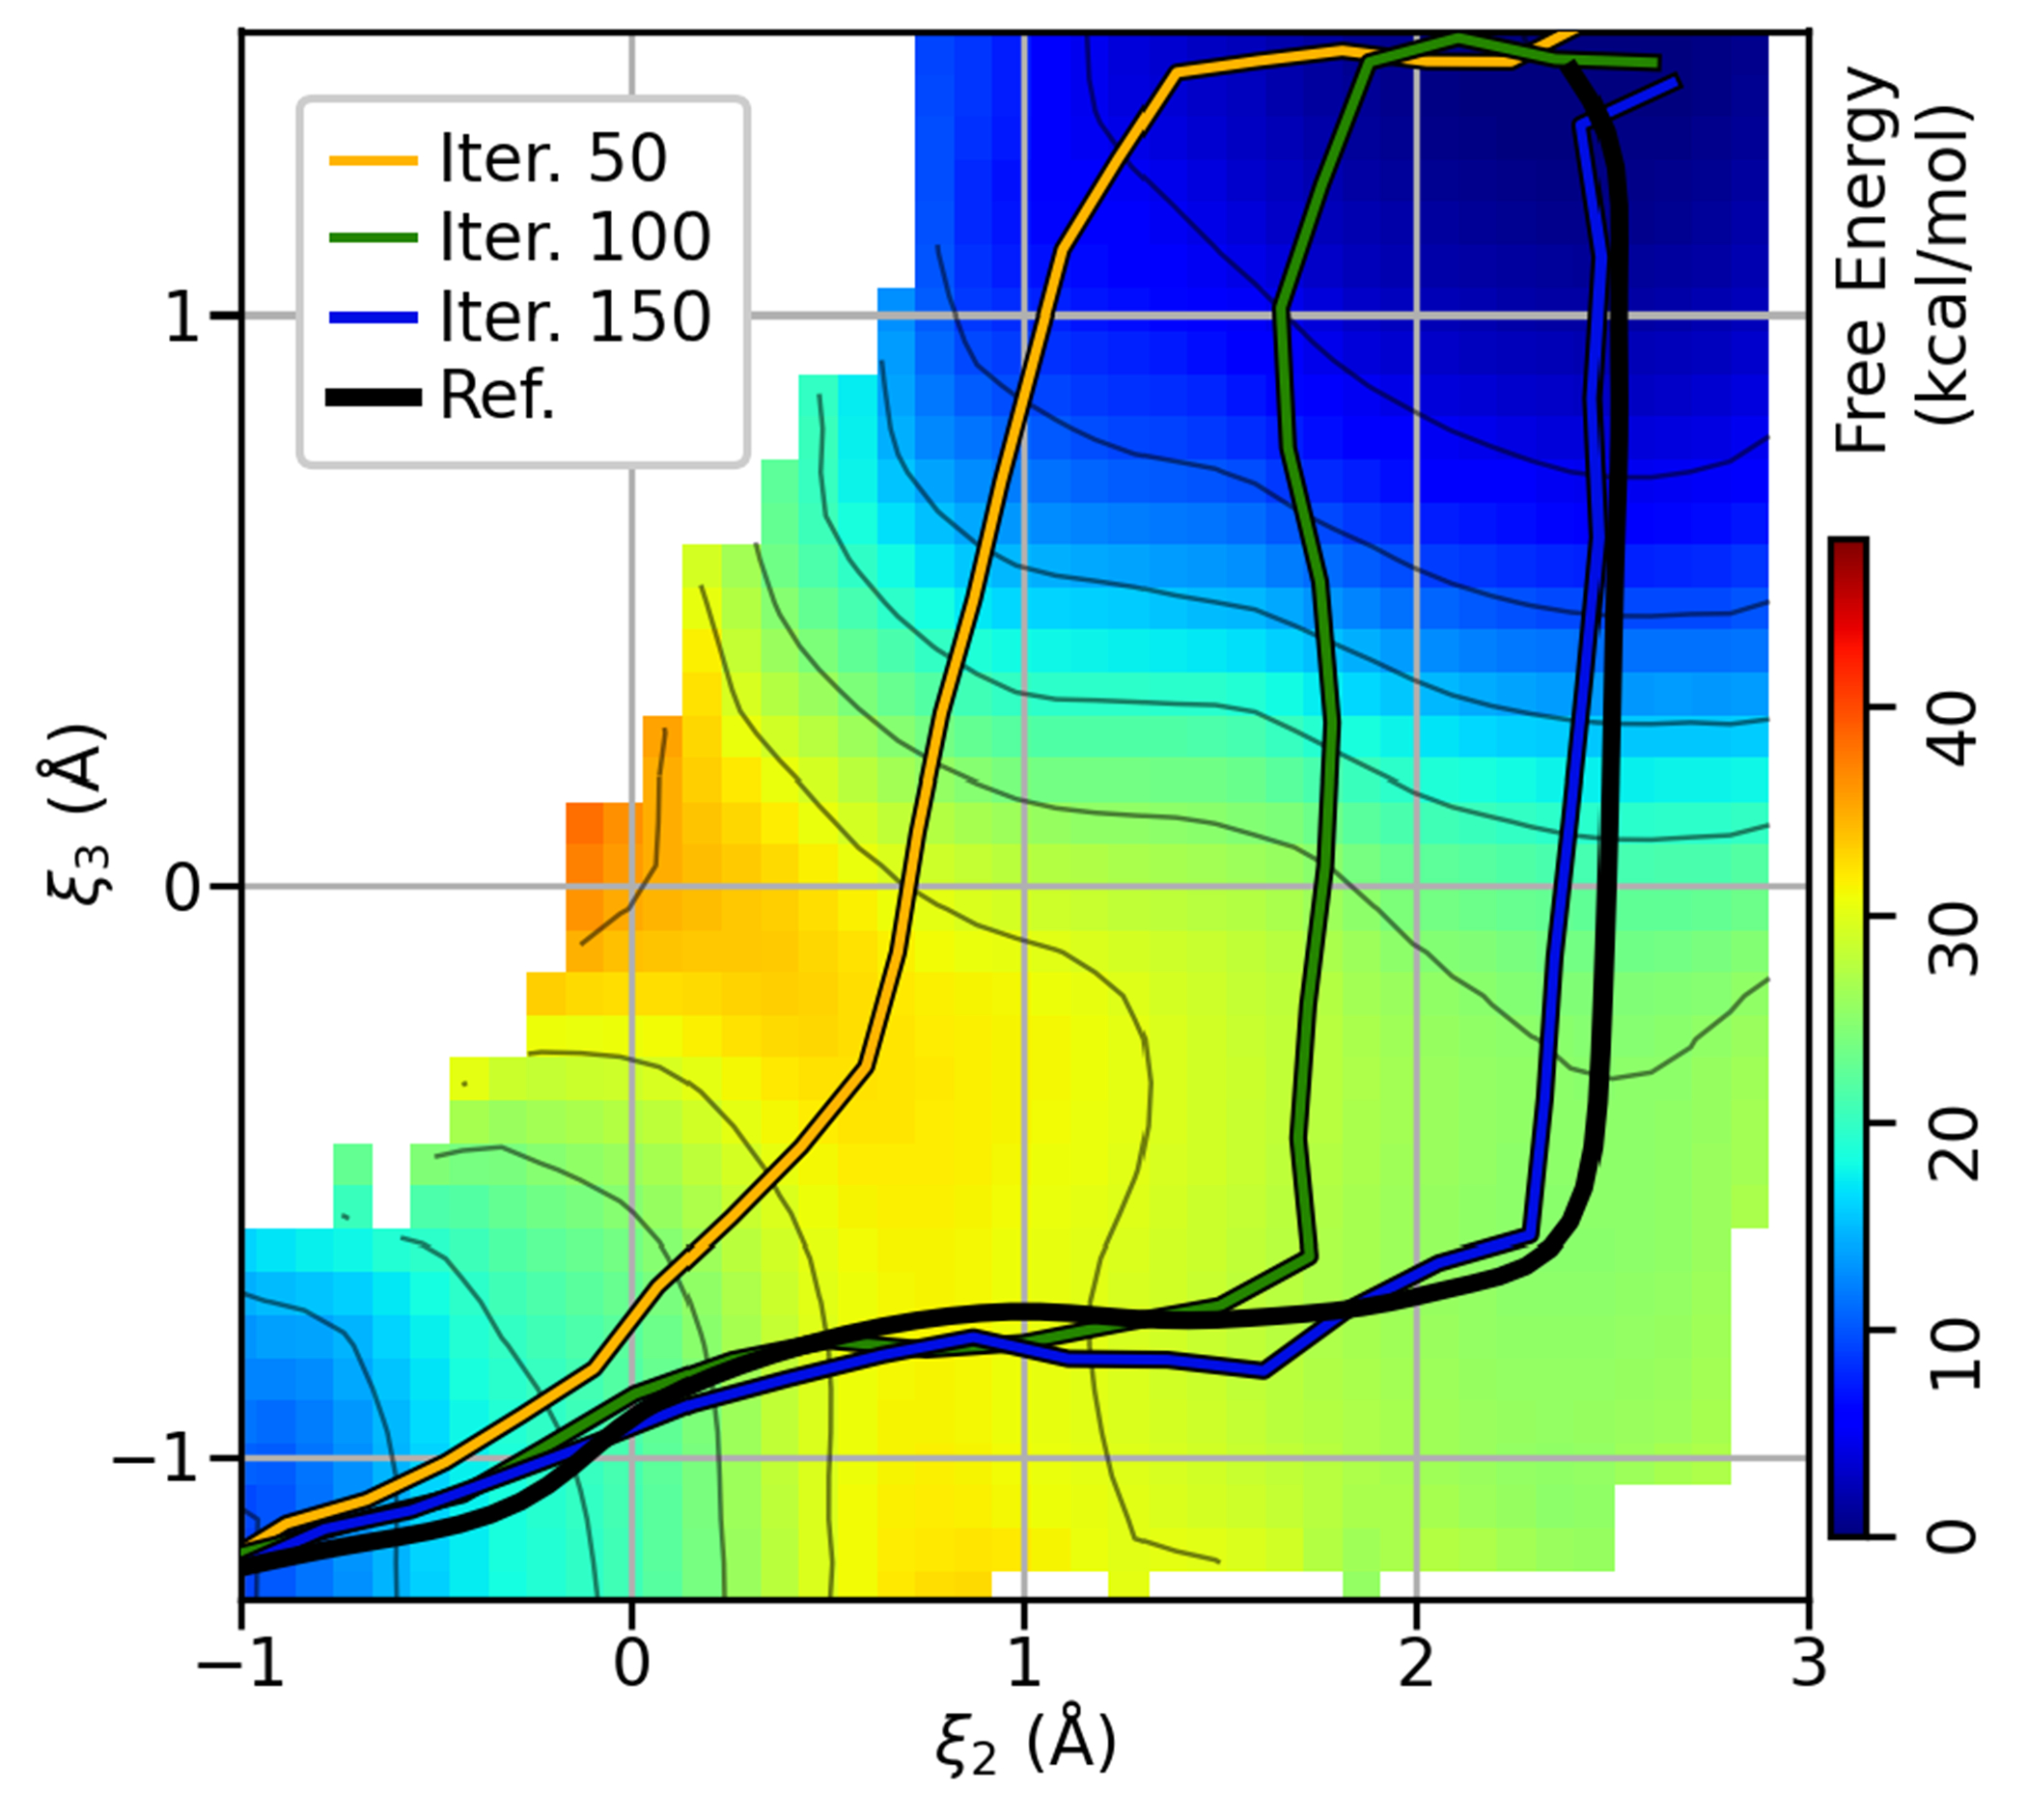
Figure 5:

Two dimensional projection of the HHr free energy surface defined by the plane. The colored lines are the MSMCV paths at iterations 50, 100, and 150, and the black line is the SASM reference curve after 300 iterations, as shown in Figure 4d. The colored areas are the free energy values calculated from the aggregate sampling produced from 300 MSMCV and 300 SASM iterations (12 ns of sampling).
