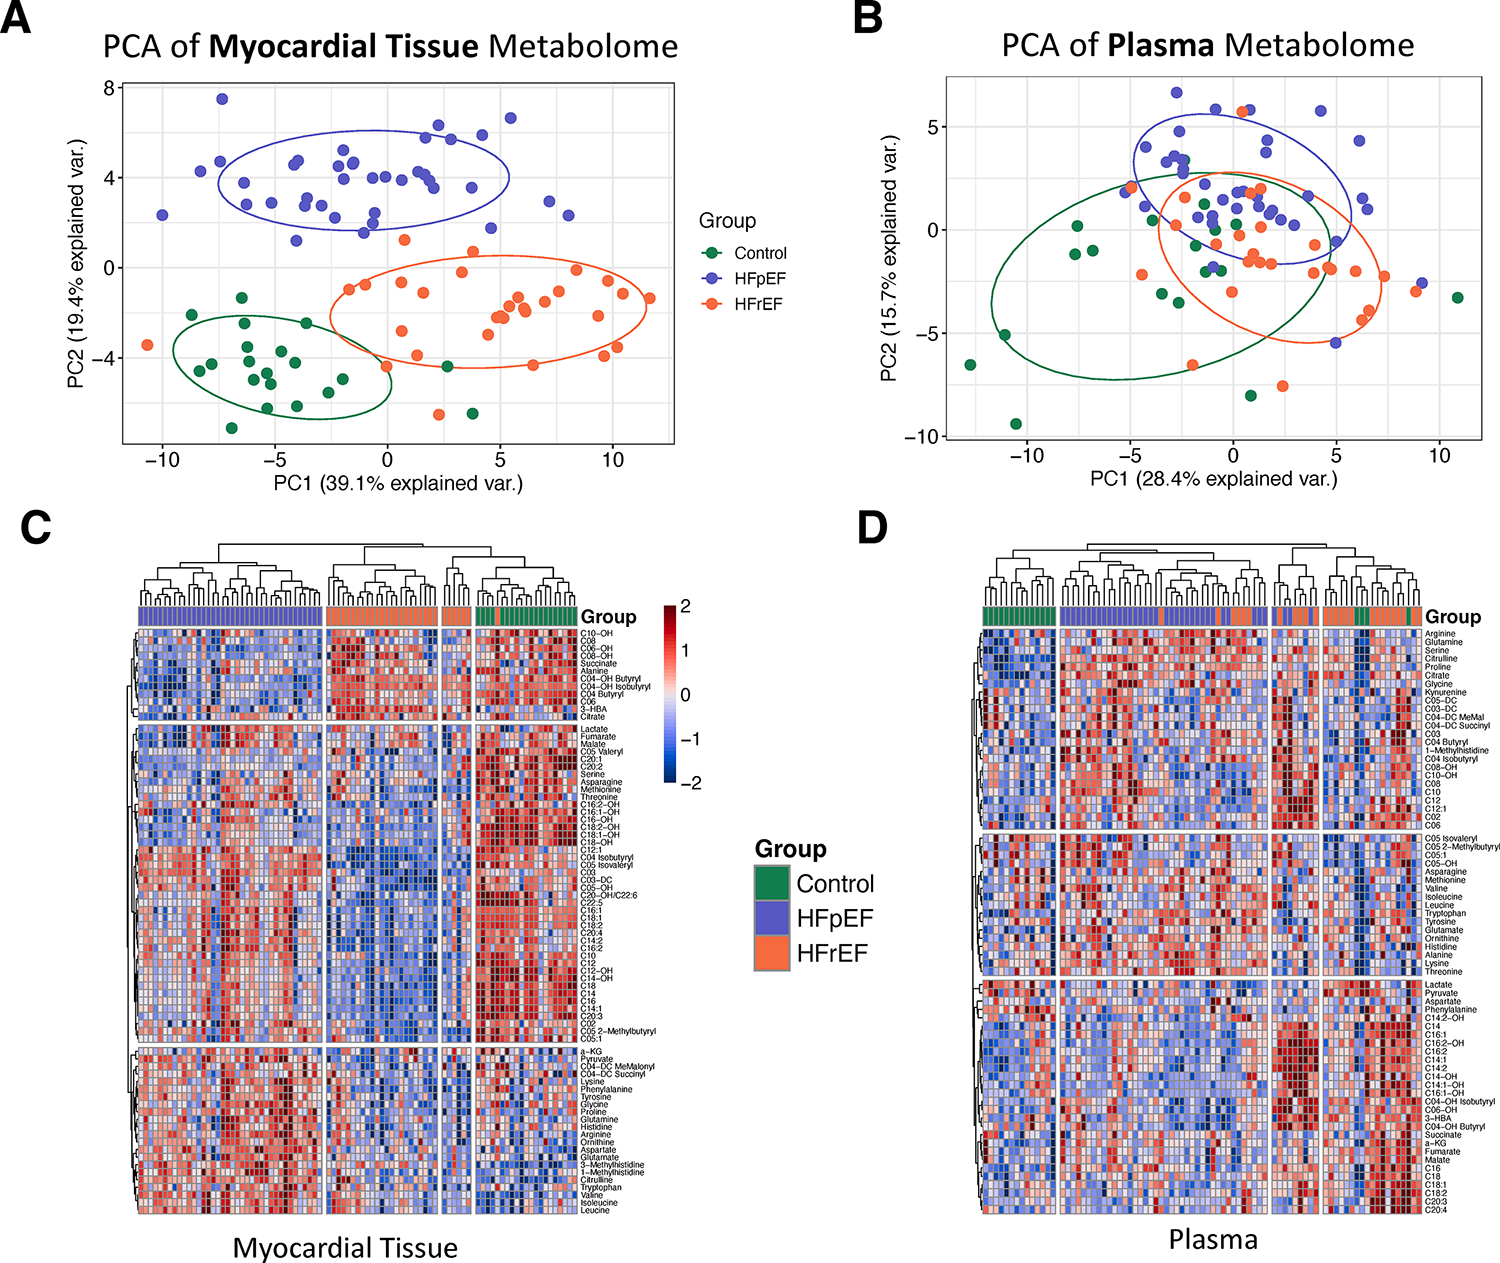
Figure 1. Myocardial metabolomic signatures in HFpEF, HFrEF and control.

A) Principal component analysis of myocardial metabolomics shows fairly distinct clusters for each subject disease group. B) Principal component analysis of plasma metabolomics shows substantial overlap between disease groups. C) Hierarchical clustering of participants (columns) using the myocardial metabolome demonstrates similar separation of the disease groups. There were 3 main clusters of metabolites (rows): cluster 1 was lower in HFpEF uniquely, cluster 2 lowest in HFrEF and intermediate in HFpEF, cluster 3 was highest in HFpEF. D) Hierarchical clustering of participants using the plasma metabolome yielded 3 clusters with substantial overlap between disease groups. PC: principal component; 3-HBA: 3-hydroxybutyric acid, a-KG: alpha-ketoglutarate, HFpEF: heart failure with preserved ejection fraction; HFrEF: heart failure with reduced ejection fraction.
