
Figure 4. Branched-chain amino acid (BCAA) metabolites and amino acids are altered in HFpEF.
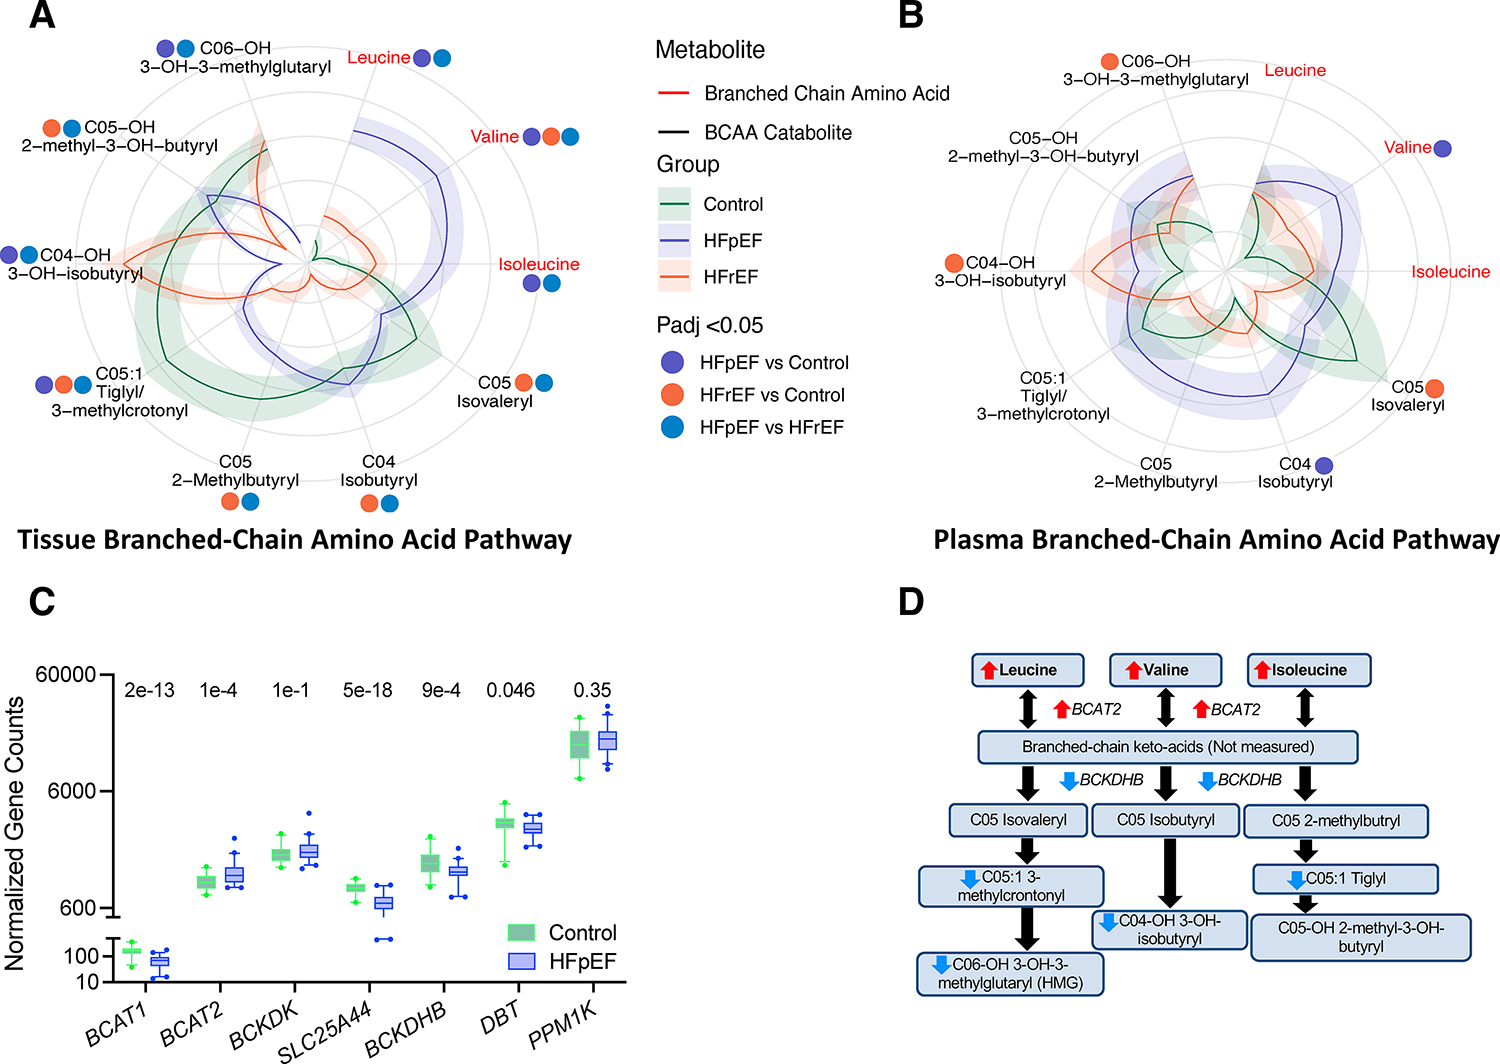
A) Polar – flower plot of myocardial BCAA and their downstream catabolites in all three groups. Data displayed as described for Figure 2A. BCAA were higher in HFpEF, but several corresponding mitochondrial carnitine catabolites were lower. BCKA were not measured. C05:1 includes an unresolved mixture of tiglyl and 3-methylcrontonyl. B) Similar display of these metabolites in plasma shows fewer significant differences and less asymmetry between BCAA and catabolites in HFpEF. P values calculated by Kruskal-Wallis test with post-hoc Dunn’s test for multiple comparisons and adjustment for multiple comparisons (Benjamini-Hochberg), and annotated by colored dots for respective comparisons. C) Box-plot for gene expression of key proteins in the BCAA metabolic pathway. Adjusted P-values from Benjamini-Hochberg multiple comparisons tests are shown for each. D) Summary diagram of differences in metabolites and gene expression of regulating proteins in the BCAA metabolic pathway comparing HFpEF to control. HFpEF: heart failure with preserved ejection fraction; HFrEF: heart failure with reduced ejection fraction. Other abbreviations in text.