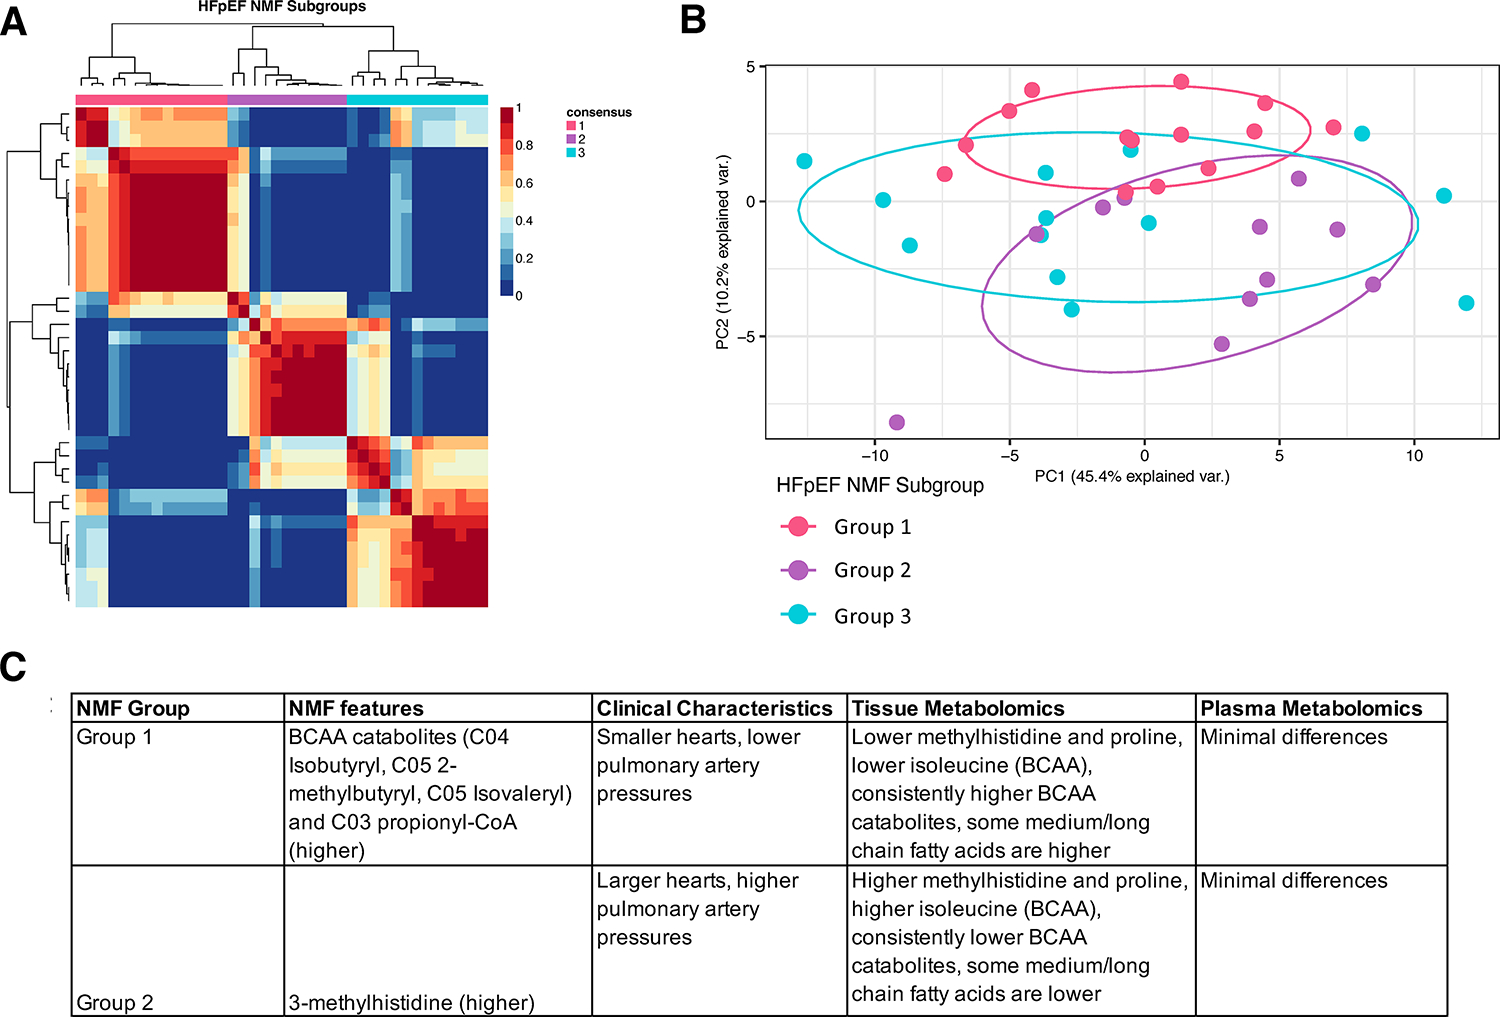
Figure 5. HFpEF subgroups identified by non-negative matrix factorization (NMF) finds substantial overlap in metabolome.

A) Patient-patient correlation plot shows classification into three groups based on 5 metabolites selected by the NMF algorithm (see text and panel C for details). B) Principal component analysis using all myocardial metabolites shows significant overlap between HFpEF NMF subgroups, with Groups 1 and 2 being the most different. C) NMF-metabolite, clinical, and tissue metabolomics differences for NMF-derived Groups 1 and 2.
