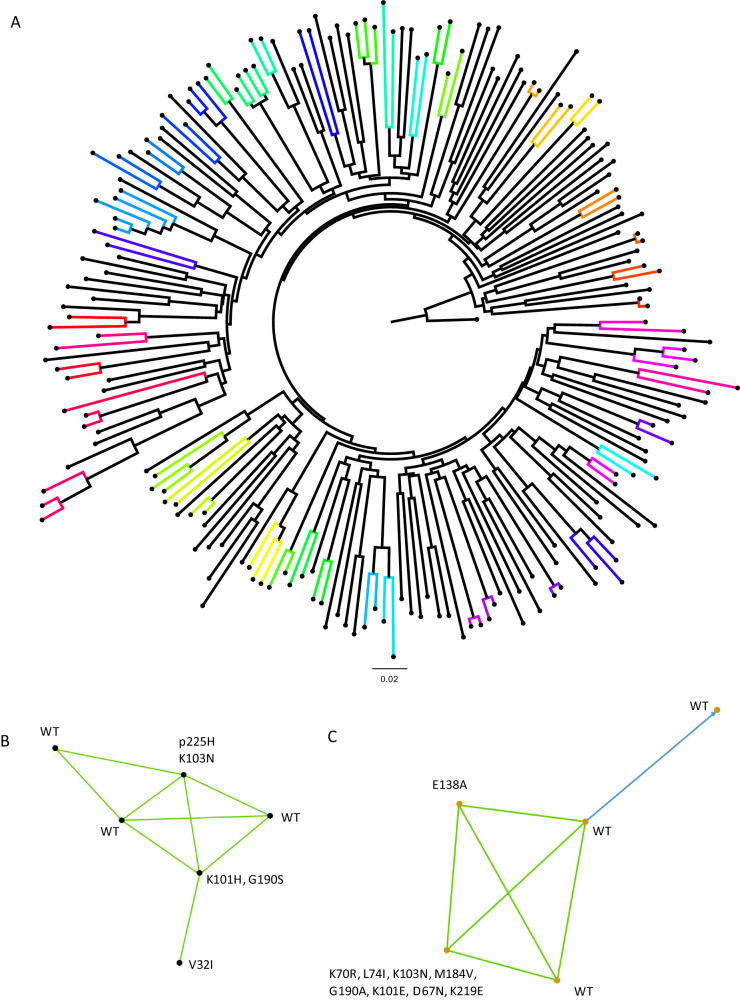
Fig. 4. Phylogenetic analysis of HIV-1 sequences and identification of transmission clusters.
A Maximum-likelihood phylogenetic tree of HIV-1 sequences that passed QC. Bootstrap support indicated at nodes. Clusters as defined by Cluster Picker using genetic distance threshold of 4.5 and statistical support by bootstrapping of >98% are coloured. B Linkage and resistance data on largest cluster with 6 participants. C Linkage and resistance data on the second largest cluster with 5 participants. Blue lines indicate >95% confidence and green indicate >80% confidence.

